Prompt templates as a data viz workflow library
Julius turns saved prompts into workflows with example outputs and visible steps, runs them in a side panel, and publishes them as SEO category pages.
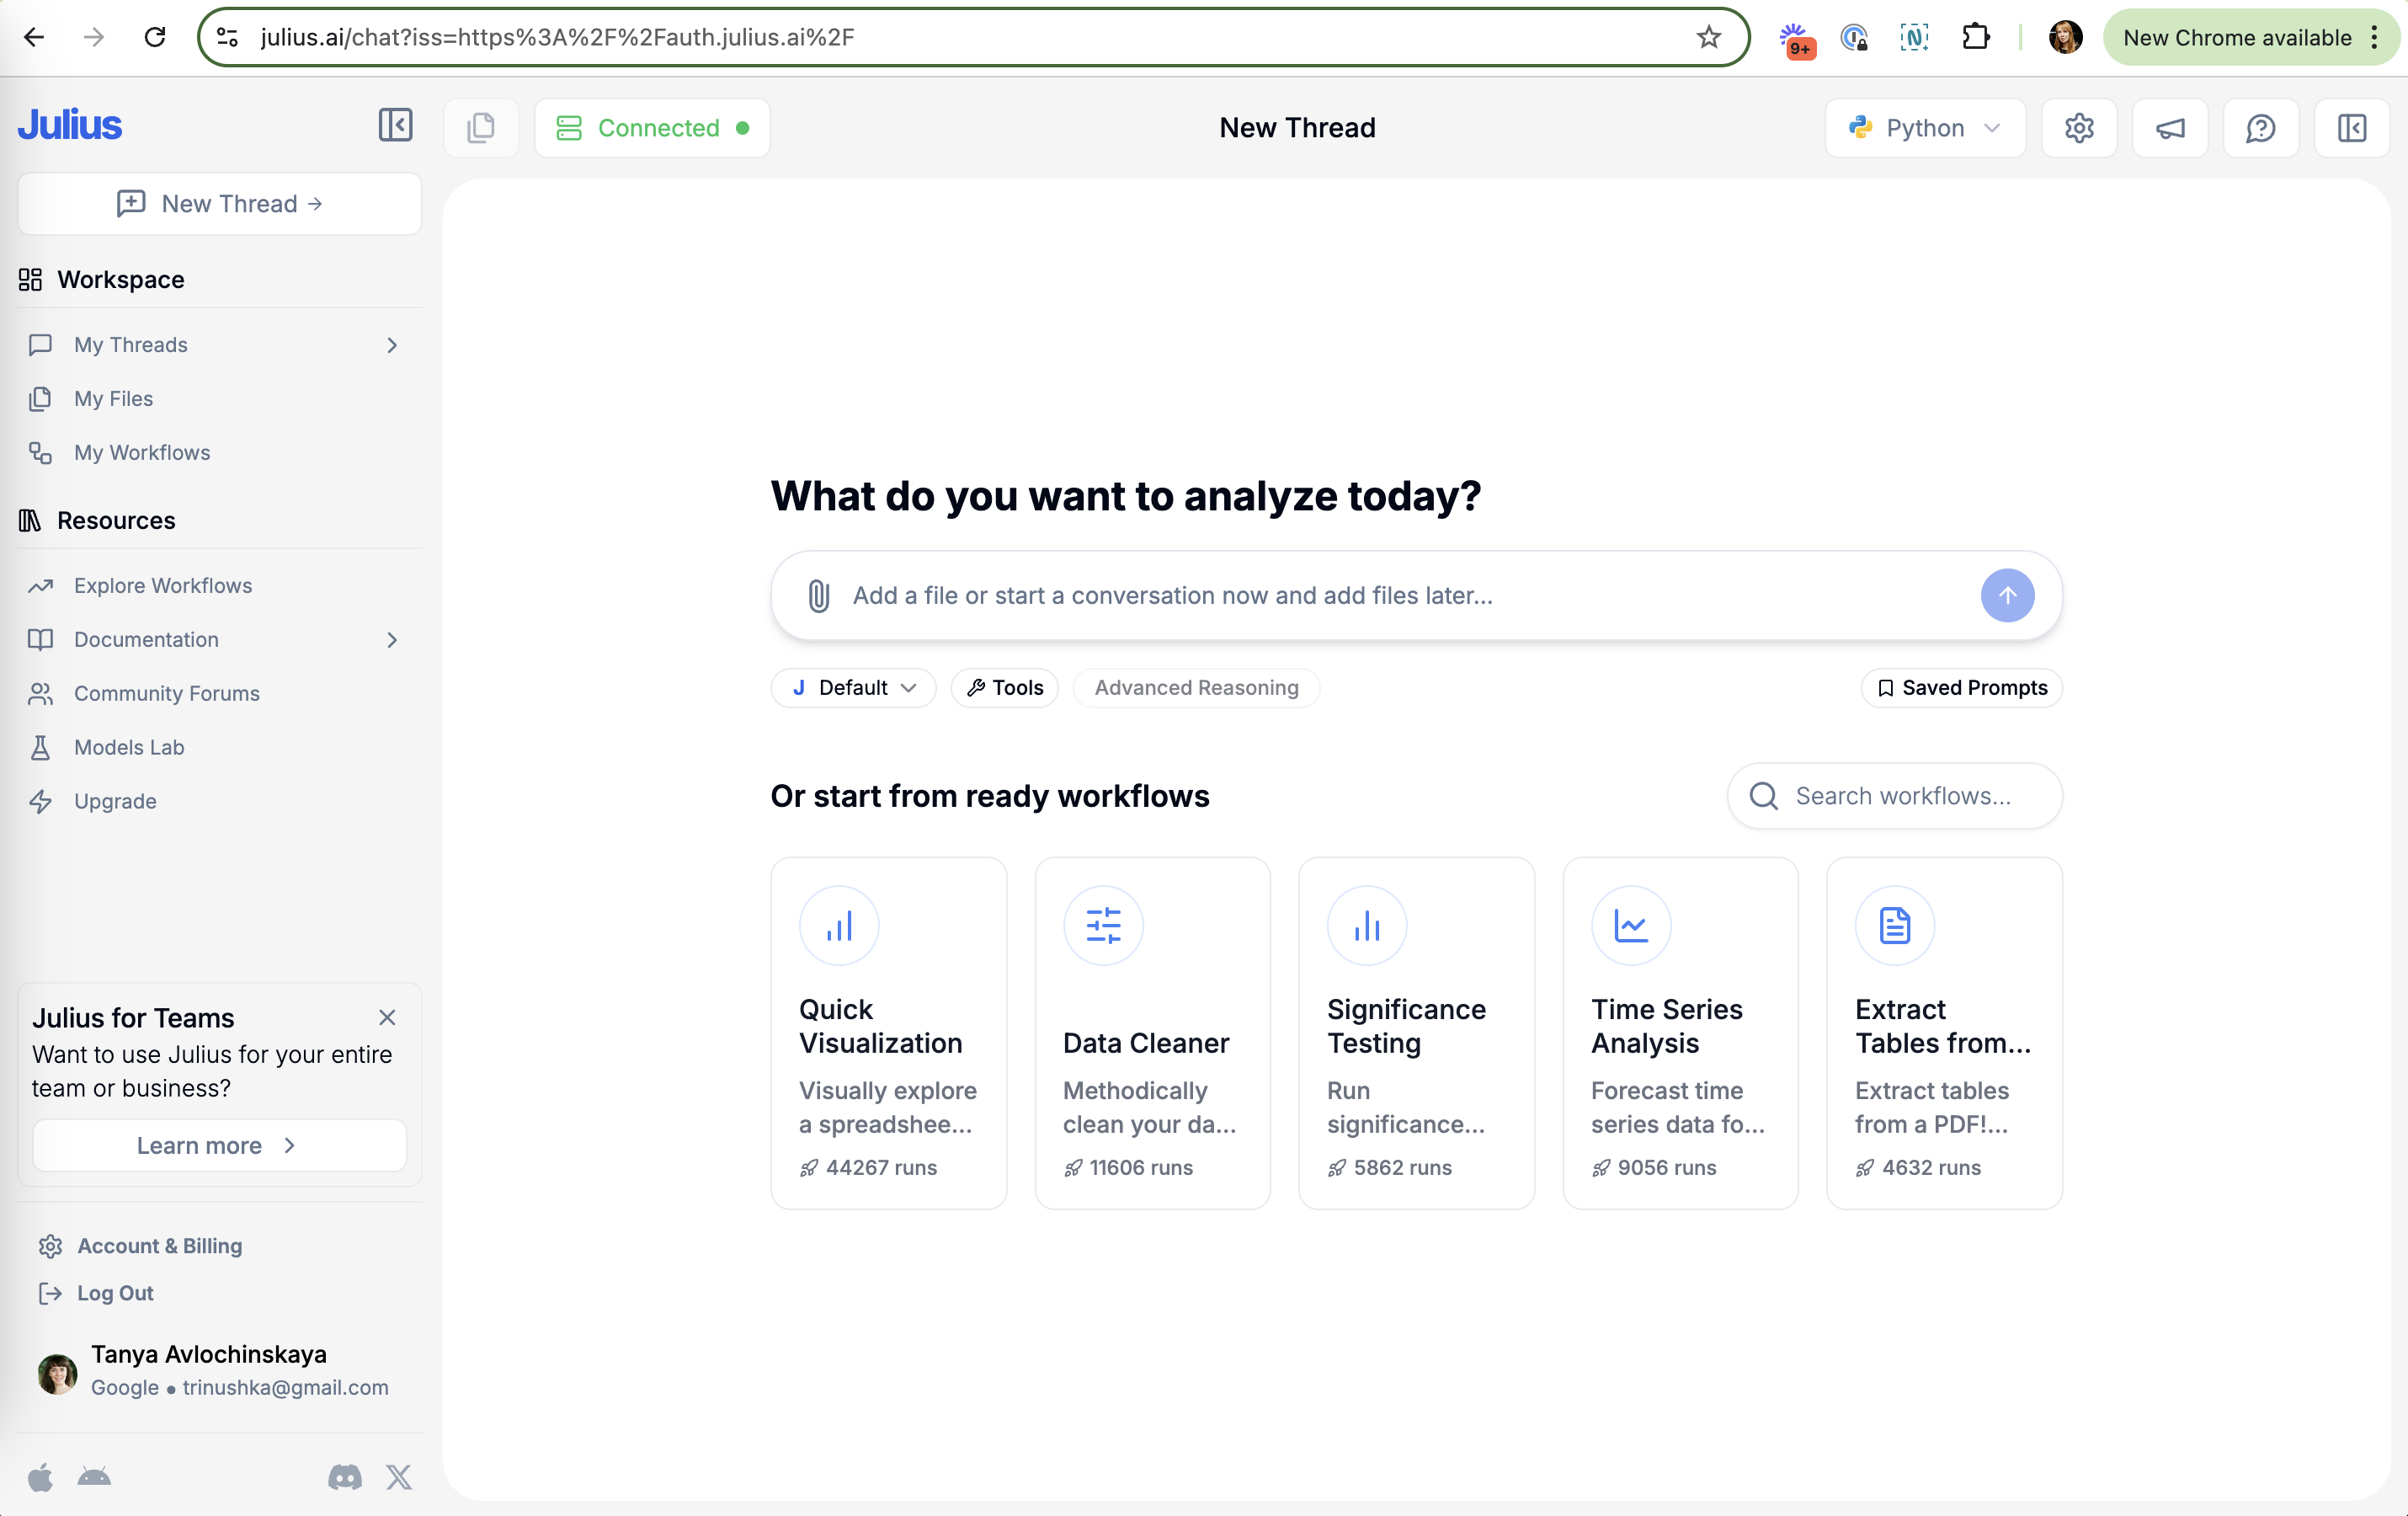
What do you want to analyze today?
The empty thread offers a prompt box and, below it, ready workflows with run counts.
-
1
Start without a file (working)
"Add a file or start a conversation now and add files later" removes the first blocker.
-
2
Unexplained mode chips (not working)
"Default", "Tools" and "Advanced Reasoning" sit under the box with no hint of what they change.
-
3
Workflows with run counts (working)
"44267 runs" on Quick Visualization tells new users where to start.
-
4
Teams upsell in the sidebar (working)
"Julius for Teams" is a small dismissible card, not a modal.
Quick Visualization
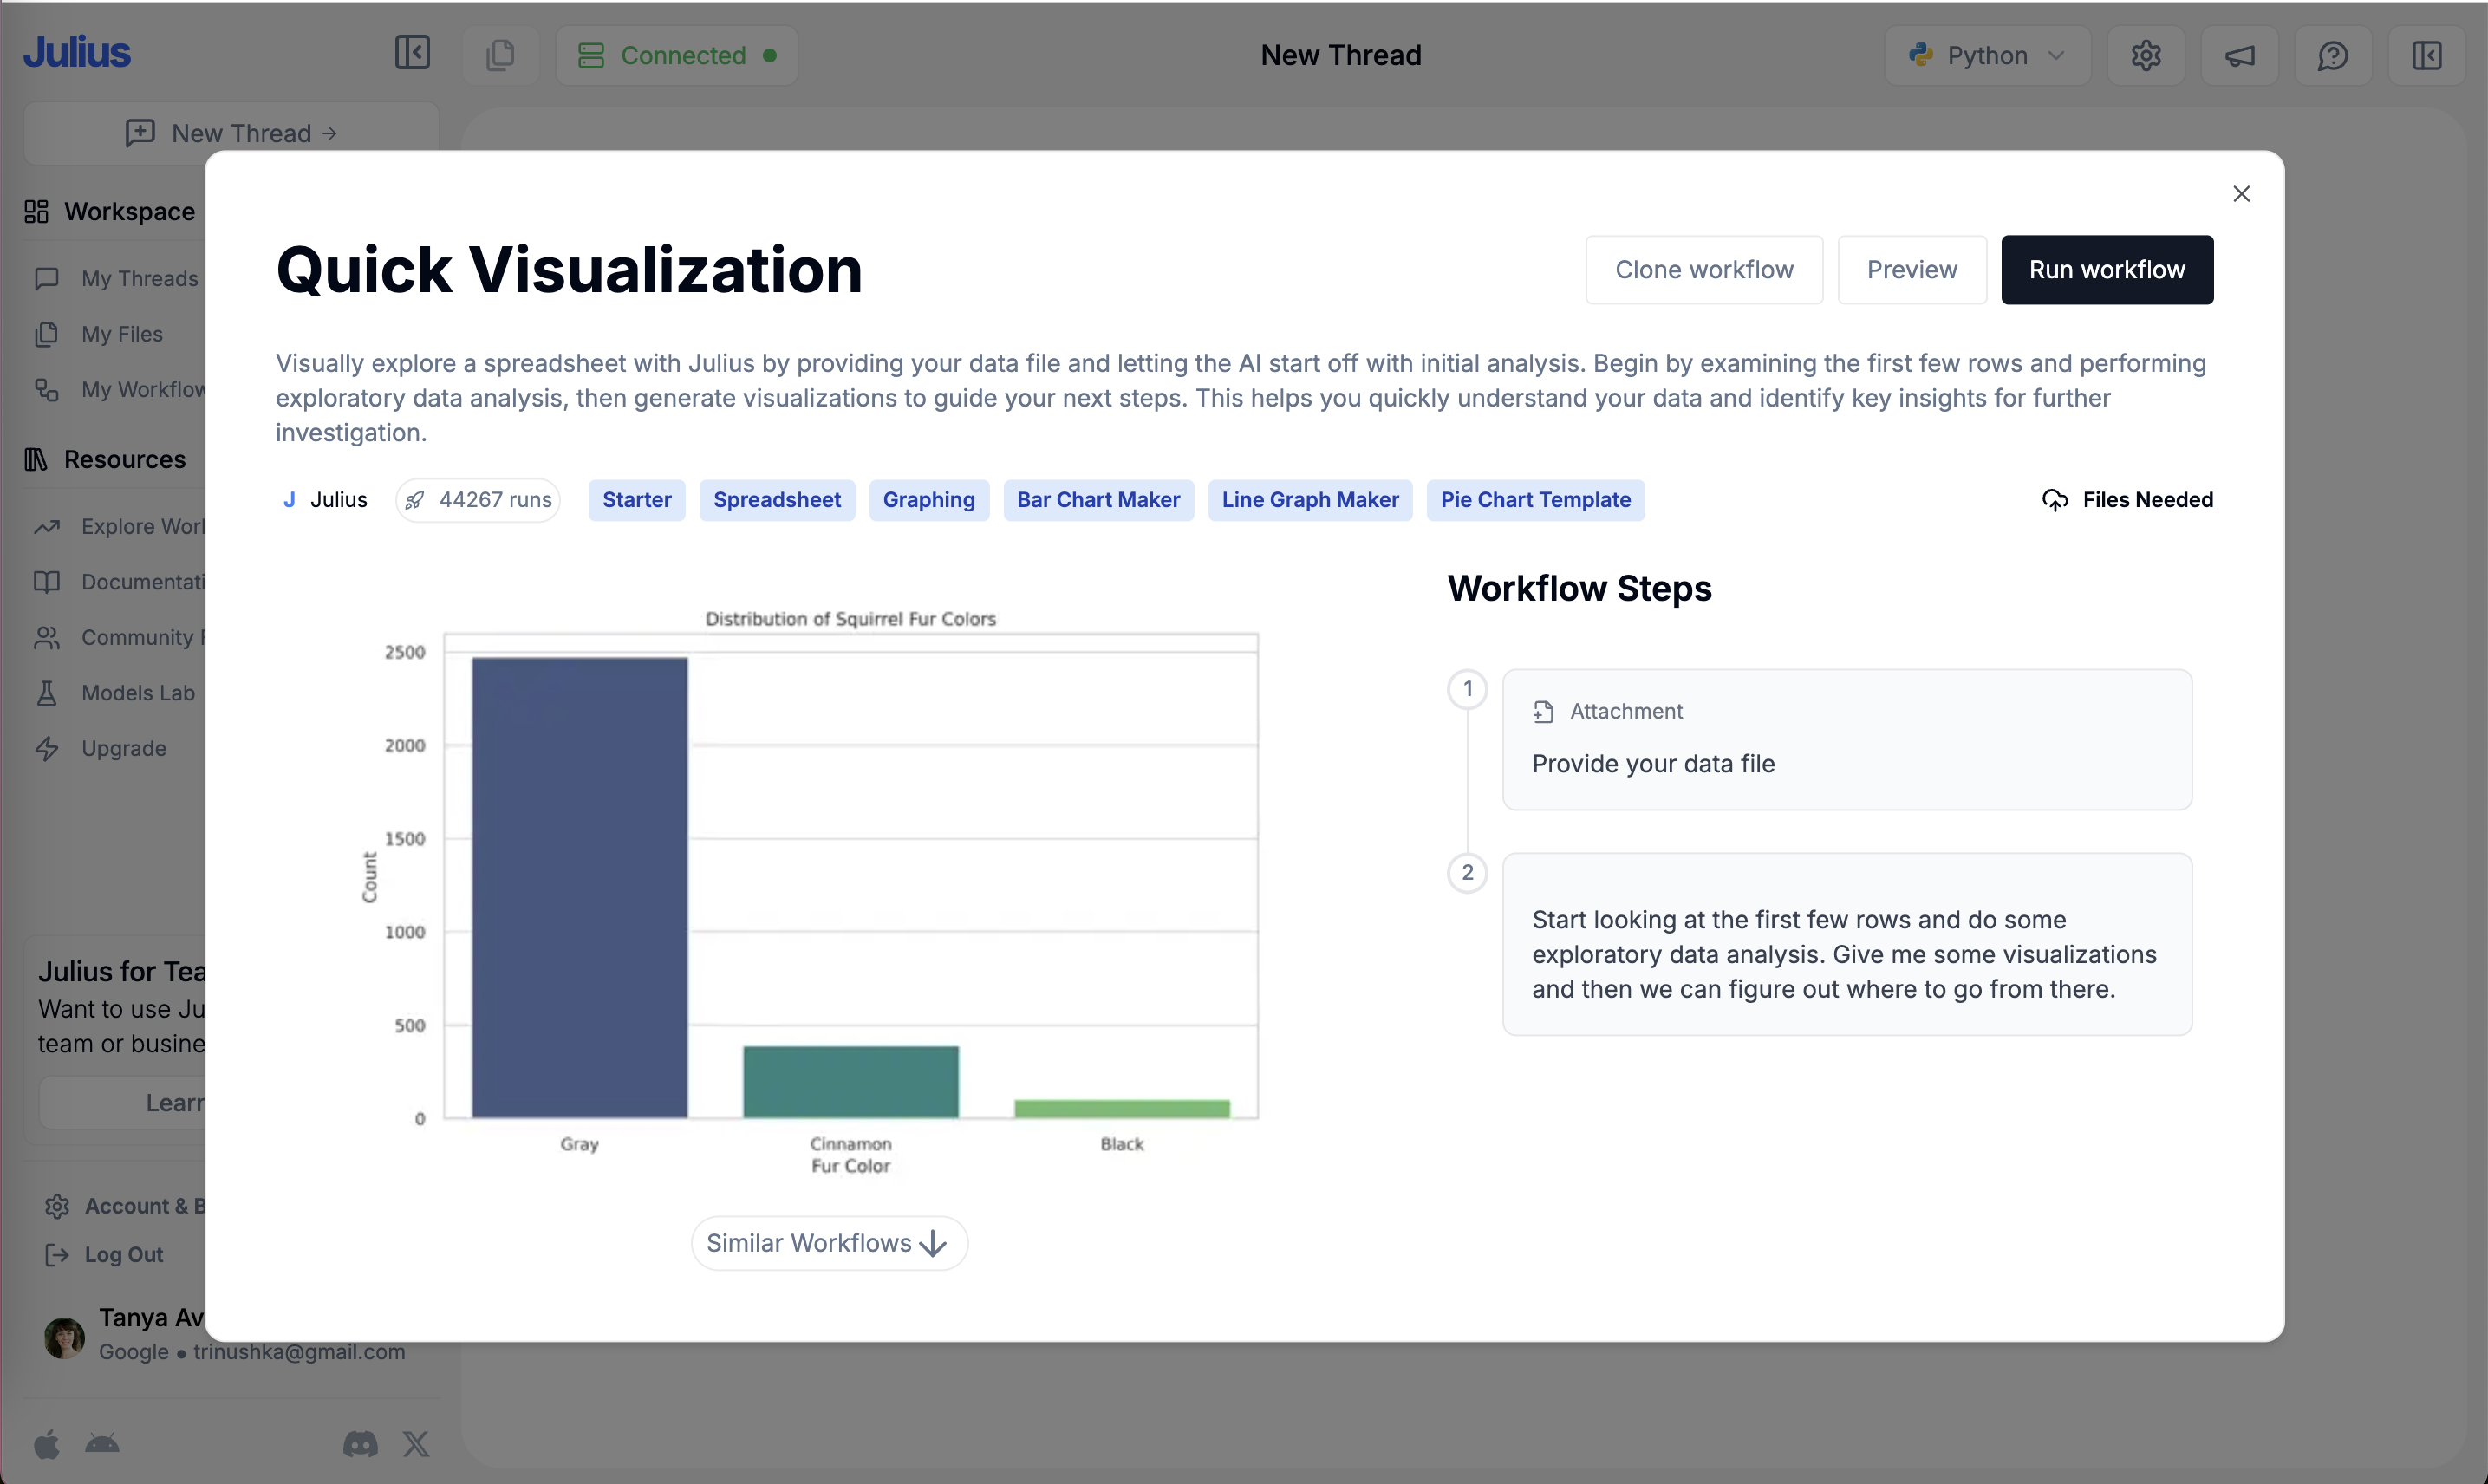
Opening a workflow shows what it does, an example result and the exact prompts it will run.
-
5
Three ways in (working)
"Clone workflow", "Preview" and a dark "Run workflow" suit both tinkerers and doers.
-
6
Keyword tags as clutter (not working)
"Graphing", "Bar Chart Maker", "Line Graph Maker" read like SEO keywords, not useful filters.
- 7
-
8
Example output (working)
A real chart ("Distribution of Squirrel Fur Colors") shows what you'll get before you upload anything.
-
9
Prompts in the open (working)
Workflow Steps show the exact prompt text, so the AI step isn't a black box.
Data Cleaner
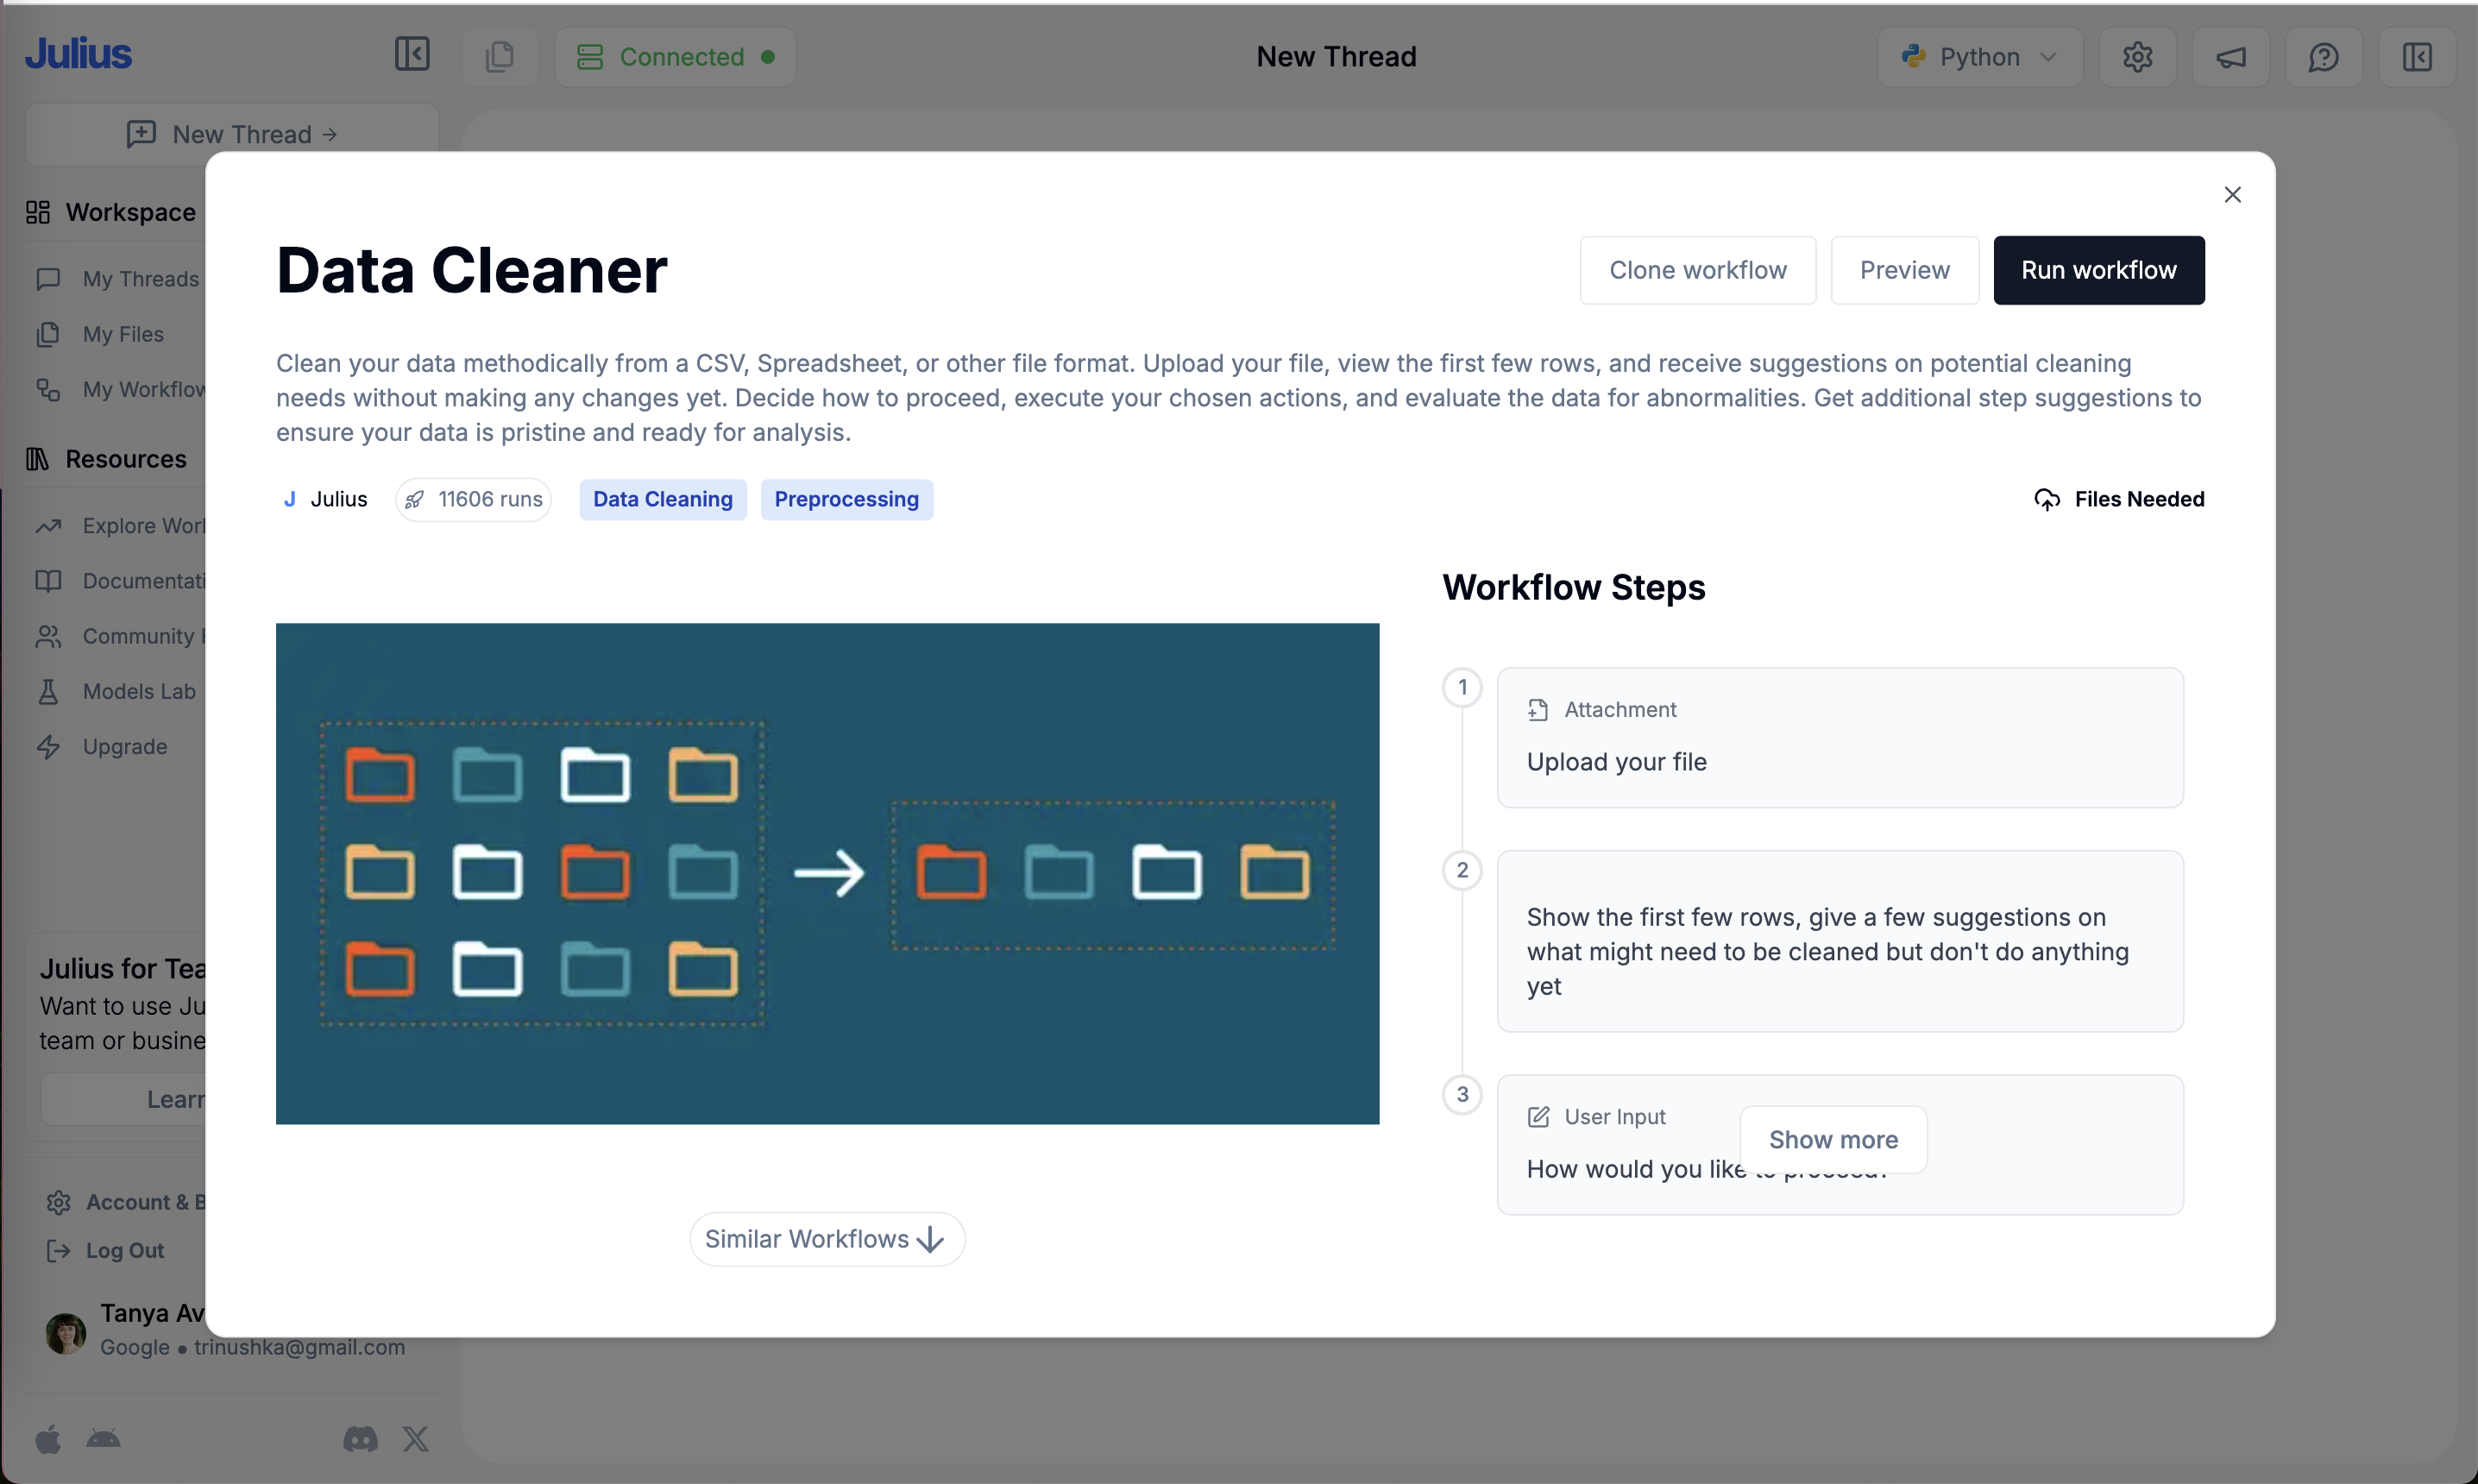
A cleaning workflow that suggests changes before applying them.
-
10
Suggest first, act later (working)
"Receive suggestions ... without making any changes yet" keeps the user in charge of their data.
-
11
Illustration, not output (not working)
Unlike Quick Visualization, the preview is a generic folders graphic, so you can't see a result.
-
12
Explicit hold step (working)
Step 2 says "don't do anything yet", a human checkpoint written into the prompt.
-
13
Show more covers the text (not working)
The "Show more" button sits on top of step 3's text, making it unreadable.
Significance Testing
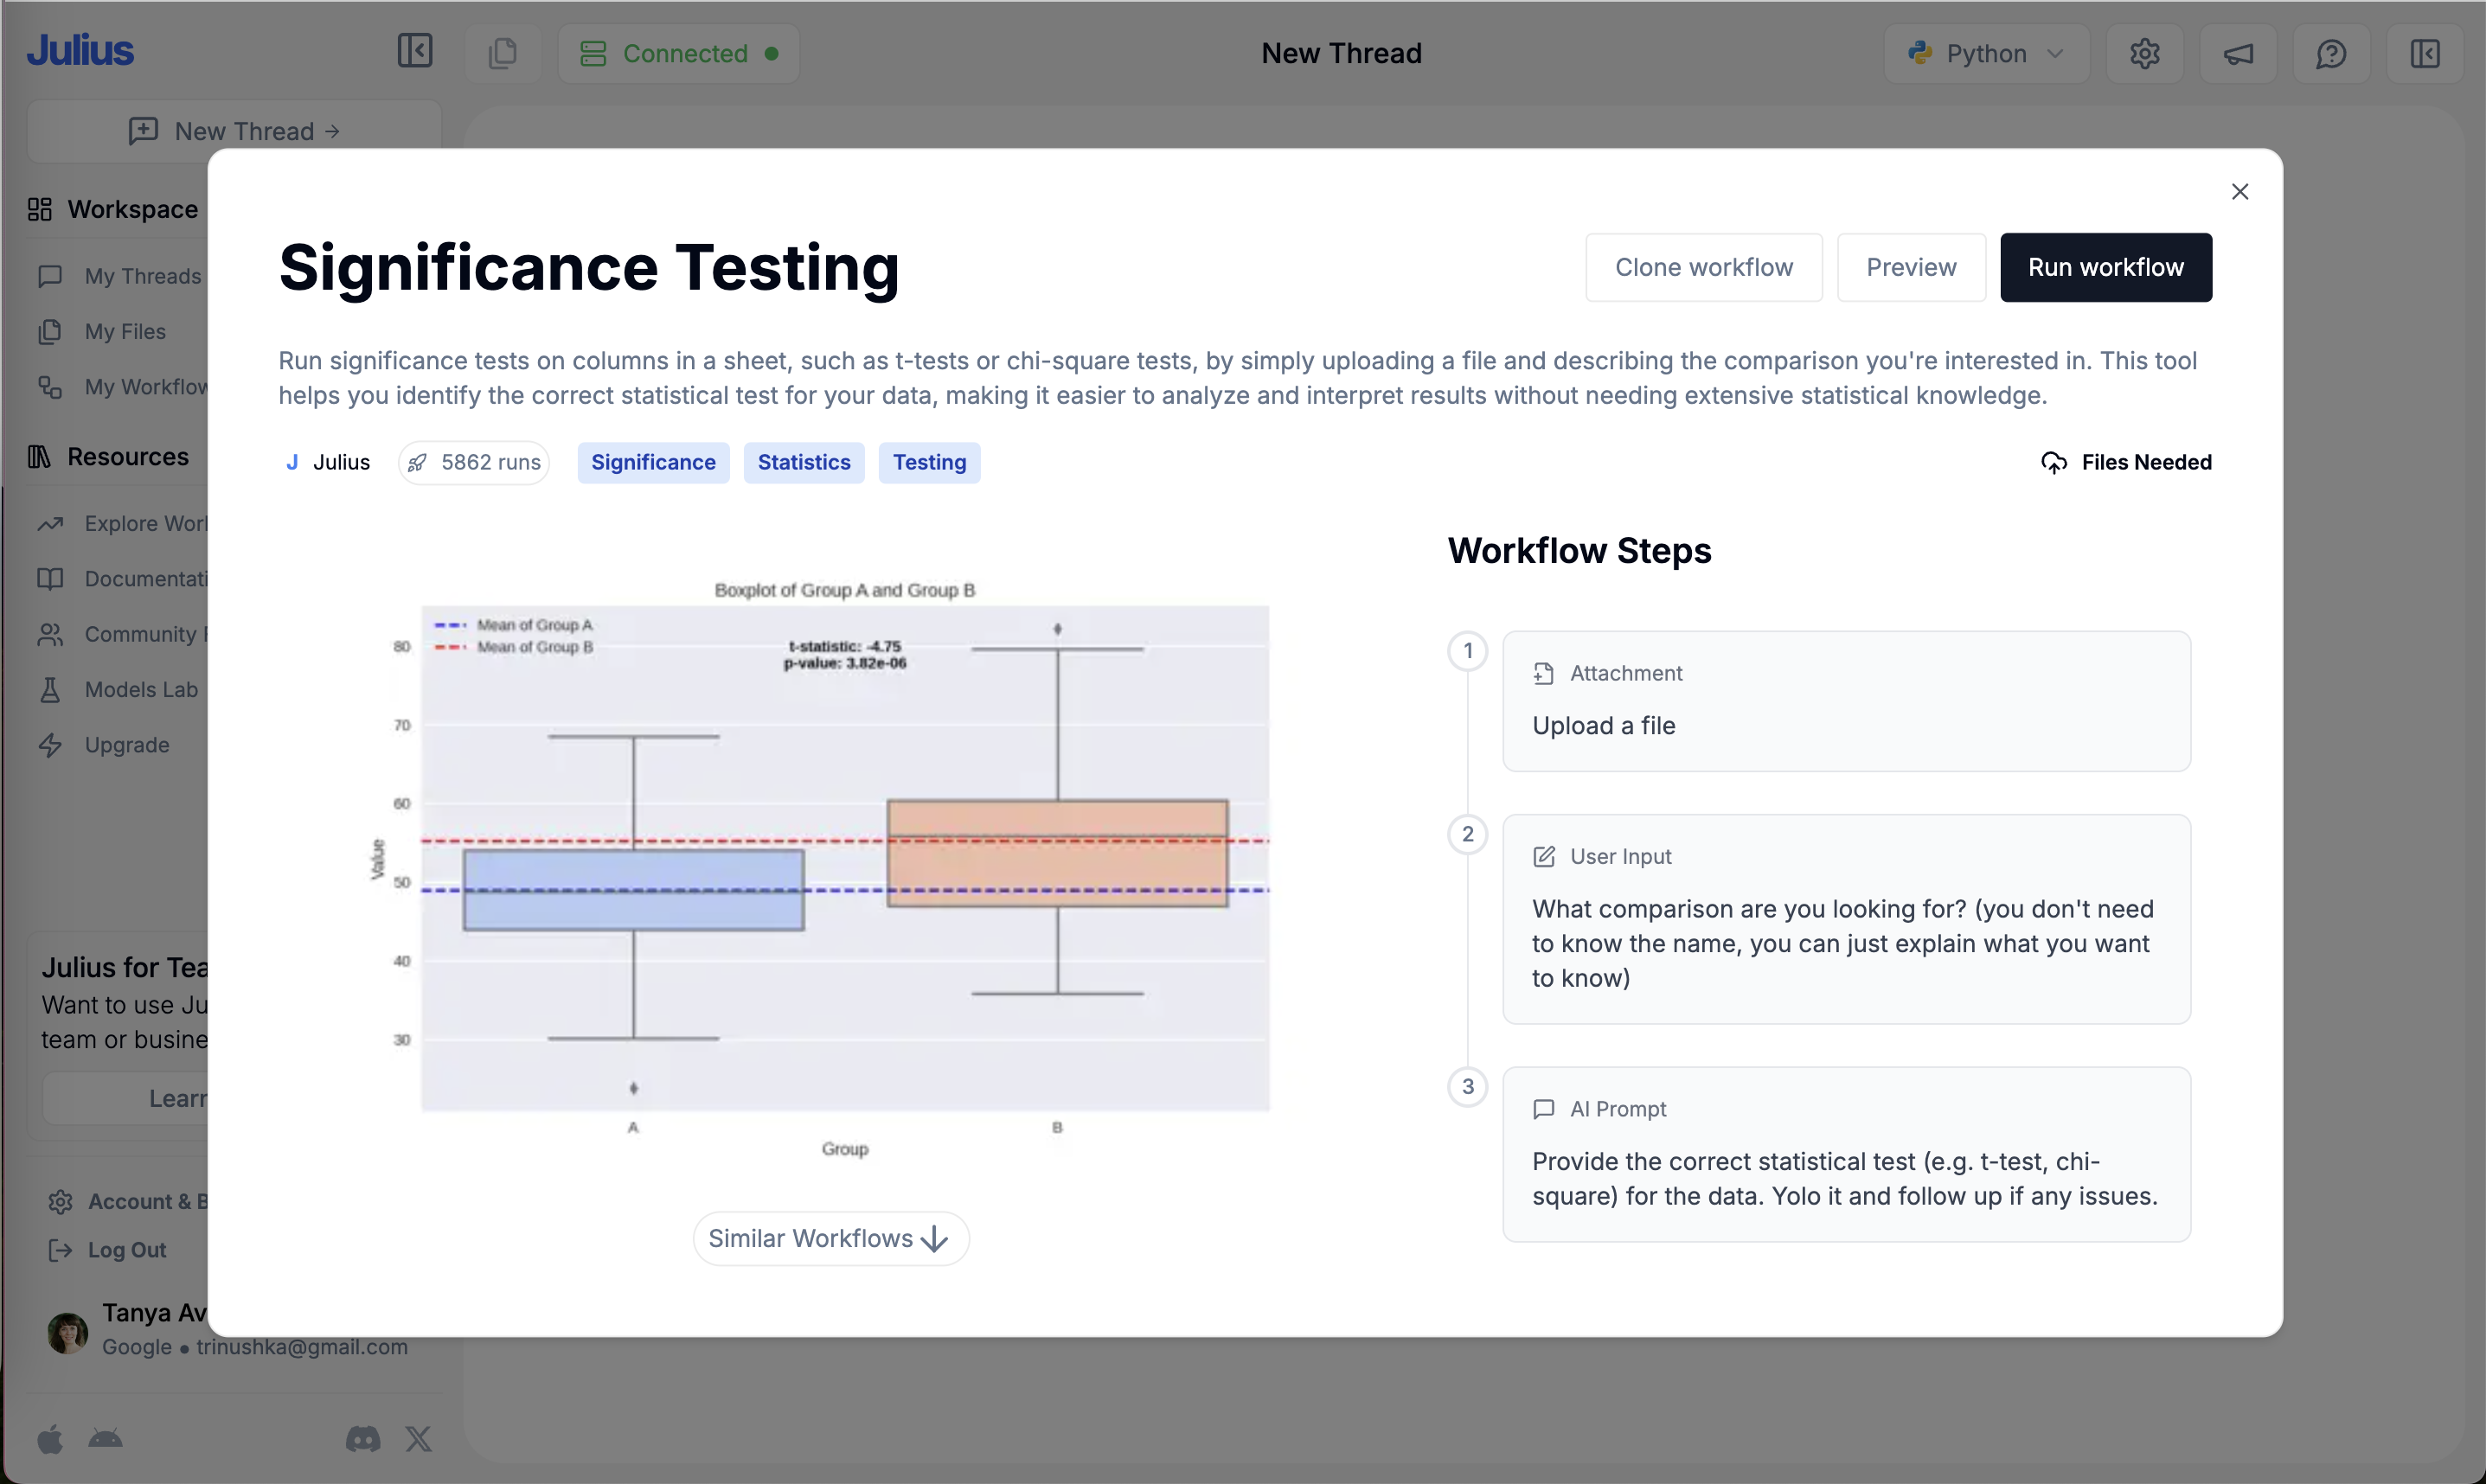
Stats for non-statisticians: describe the comparison and Julius picks the test.
-
14
No jargon needed (working)
"Without needing extensive statistical knowledge" names the barrier and removes it.
-
15
Real result preview (working)
A boxplot with t-statistic and p-value shows the level of output to expect.
-
16
Plain-language input (working)
"You don't need to know the name, you can just explain what you want to know".
-
17
"Yolo it" in a stats tool (not working)
The visible prompt says "Yolo it and follow up if any issues", which undercuts trust in the result.
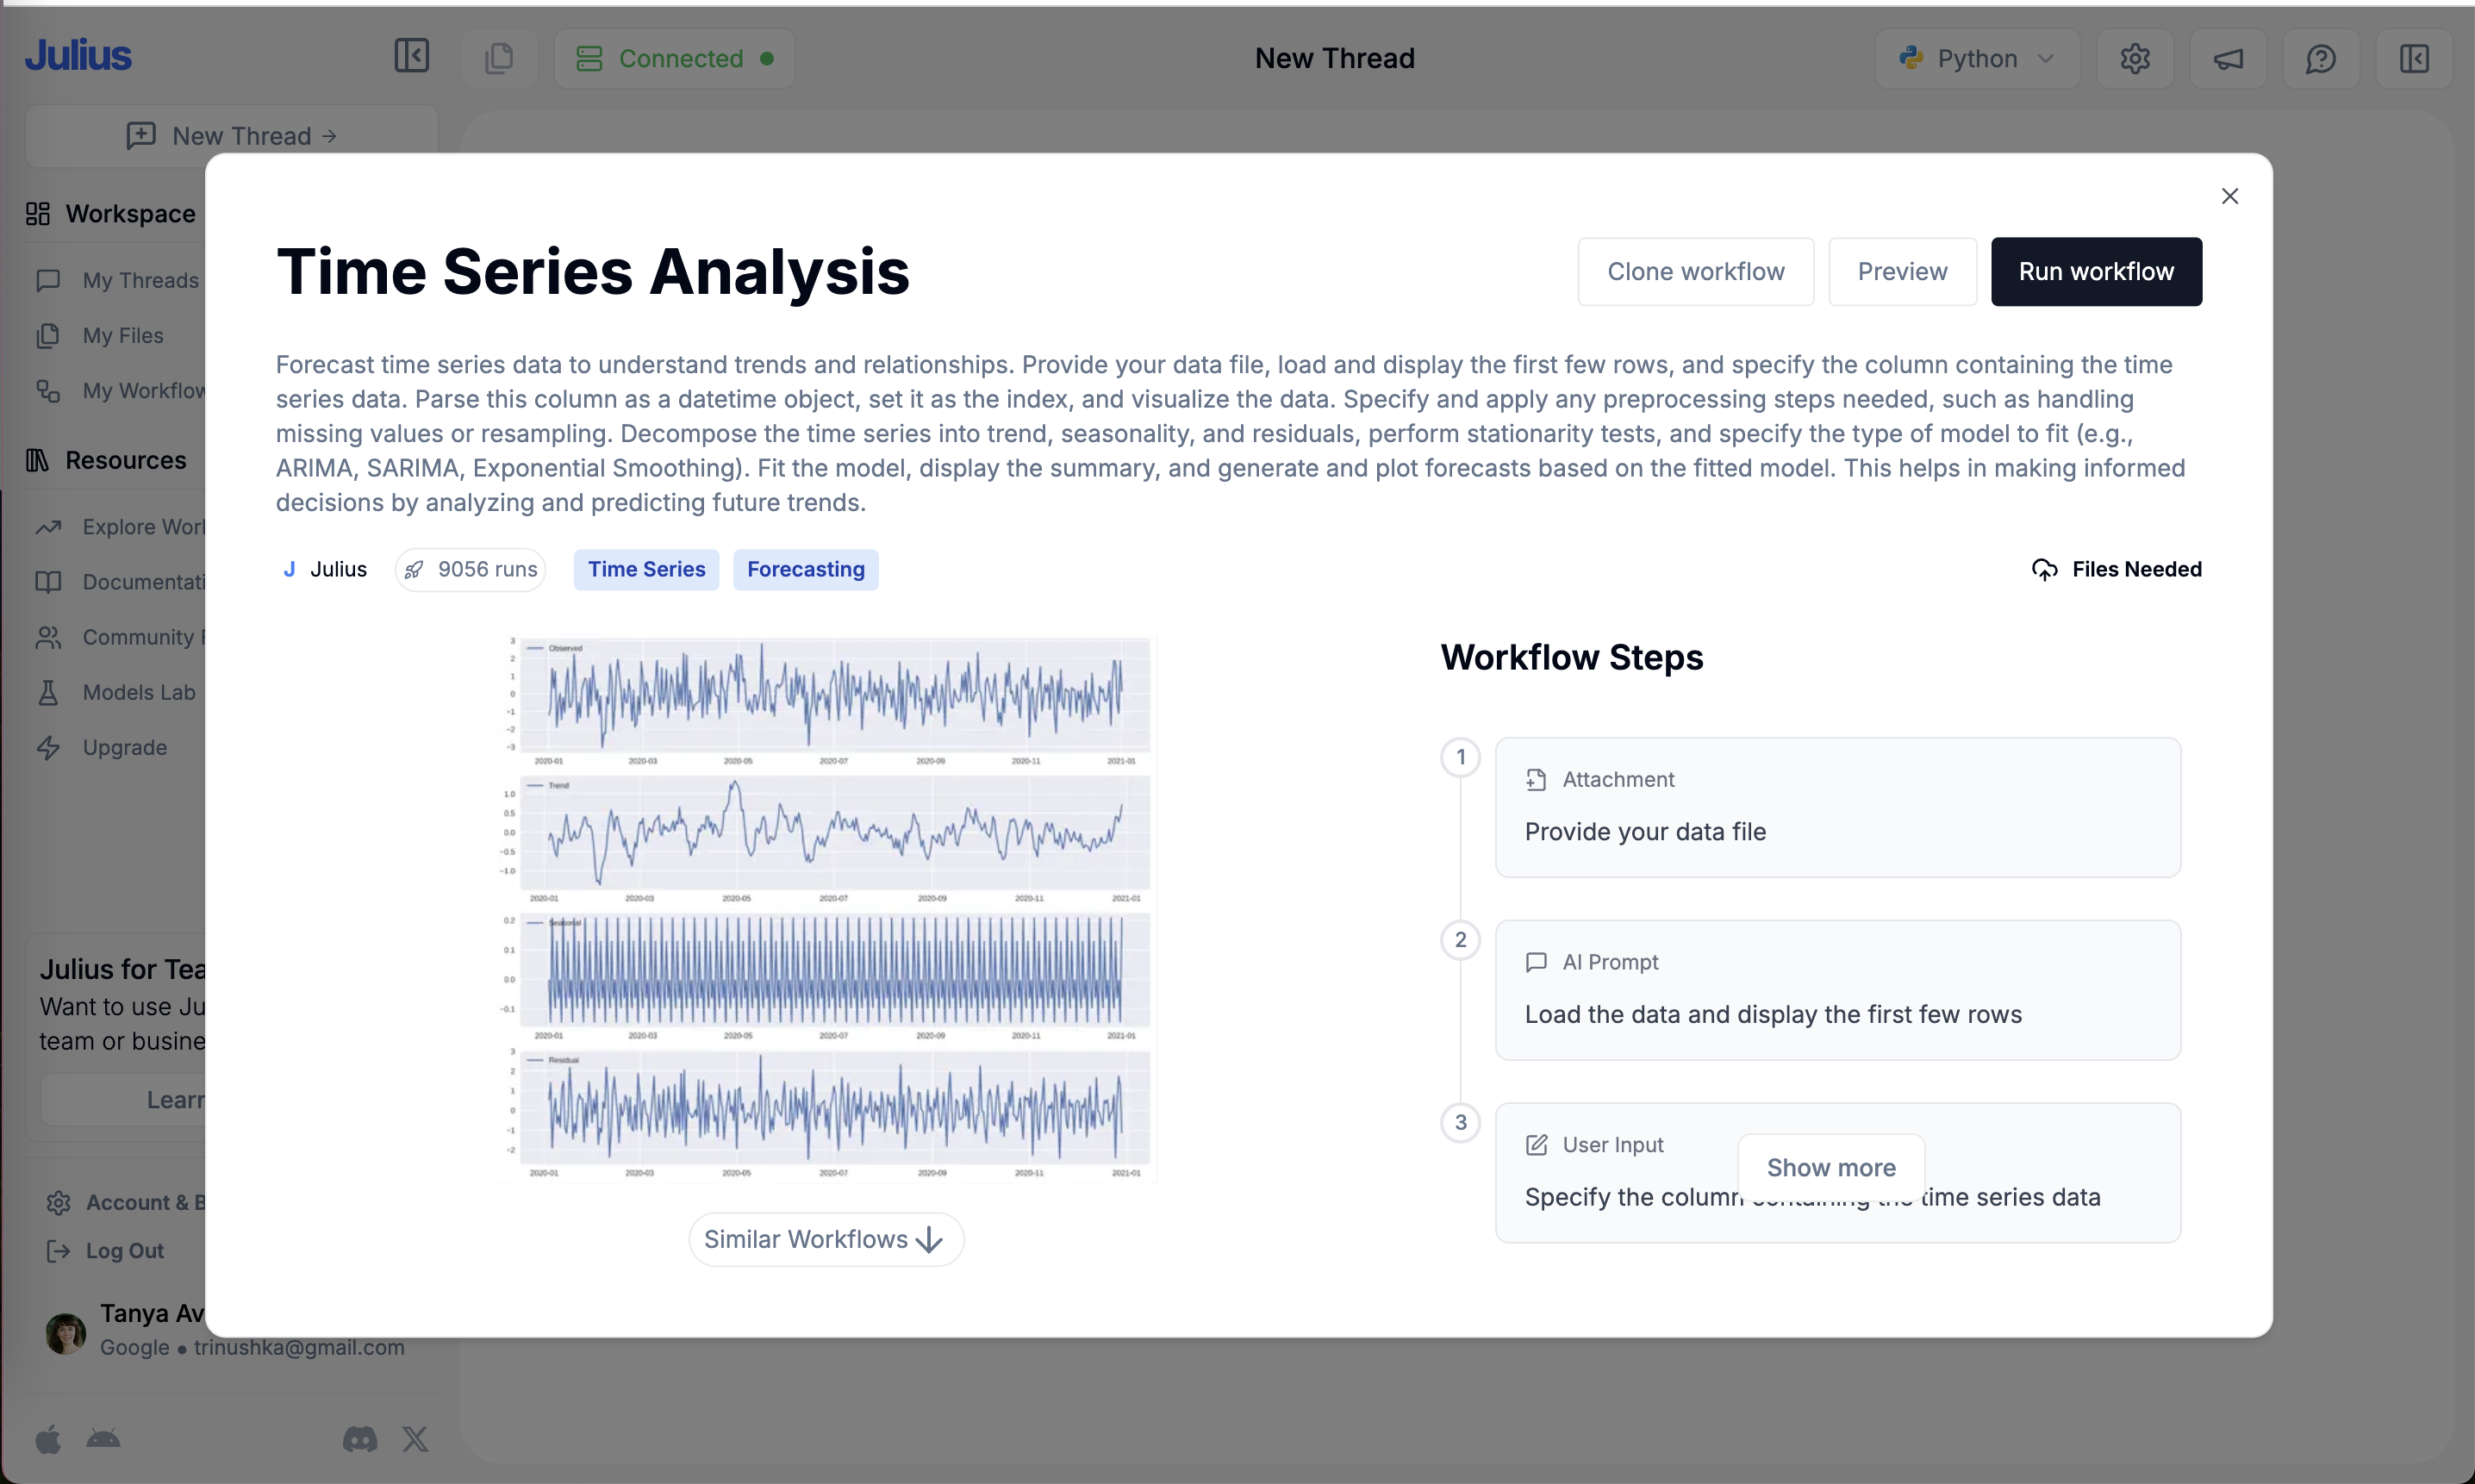
Time Series Analysis
An advanced workflow with a decomposition chart preview.
-
18
Wall of jargon (not working)
ARIMA, SARIMA, stationarity tests in a five-line paragraph, the opposite of the significance workflow's tone.
- 19
-
20
Decomposition preview (working)
Observed, trend, seasonal and residual panels preview the output.
-
21
Same overlap bug (not working)
"Show more" again covers step 3 ("Specify the column ... time series data").
Running the workflow: provide your data
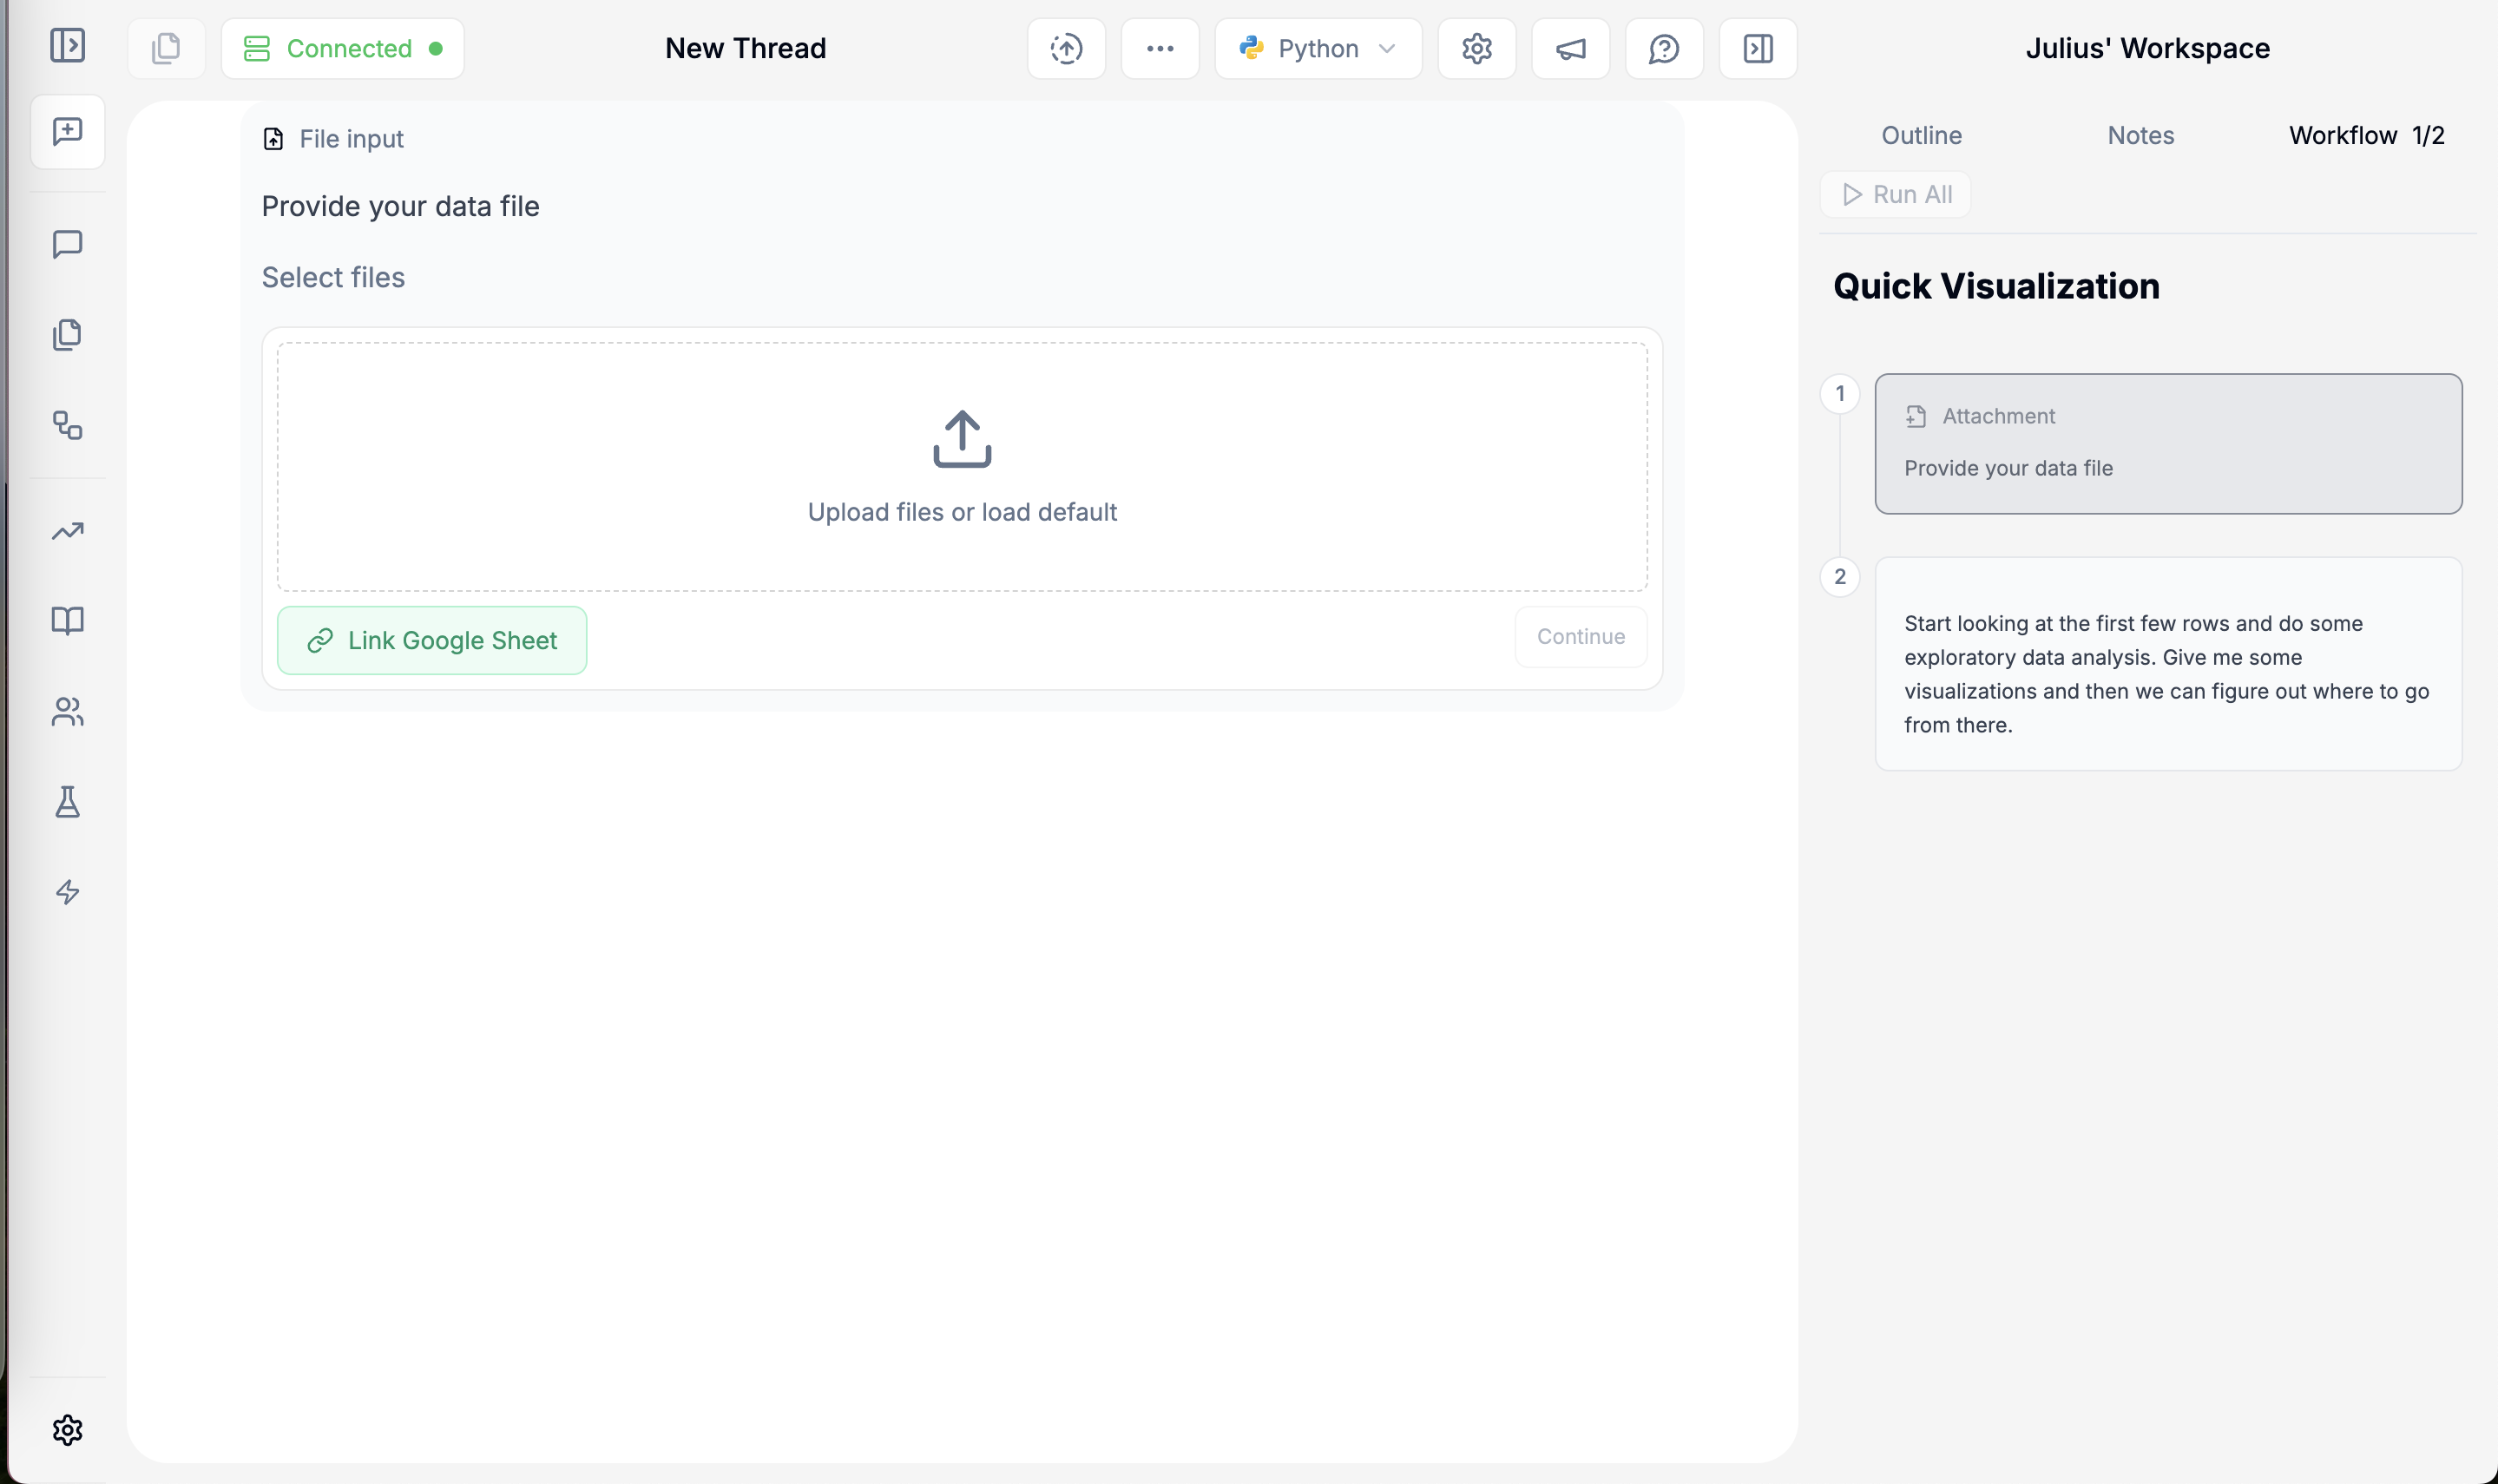
The run opens as a thread with the workflow steps pinned on the right.
-
22
Sample data option (working)
"Upload files or load default" lets you try the workflow with no data of your own.
-
23
Google Sheets link (working)
"Link Google Sheet" covers the most common data source without a download.
- 24
-
25
Plan beside the chat (working)
The steps stay visible on the right while you work, step 1 highlighted.
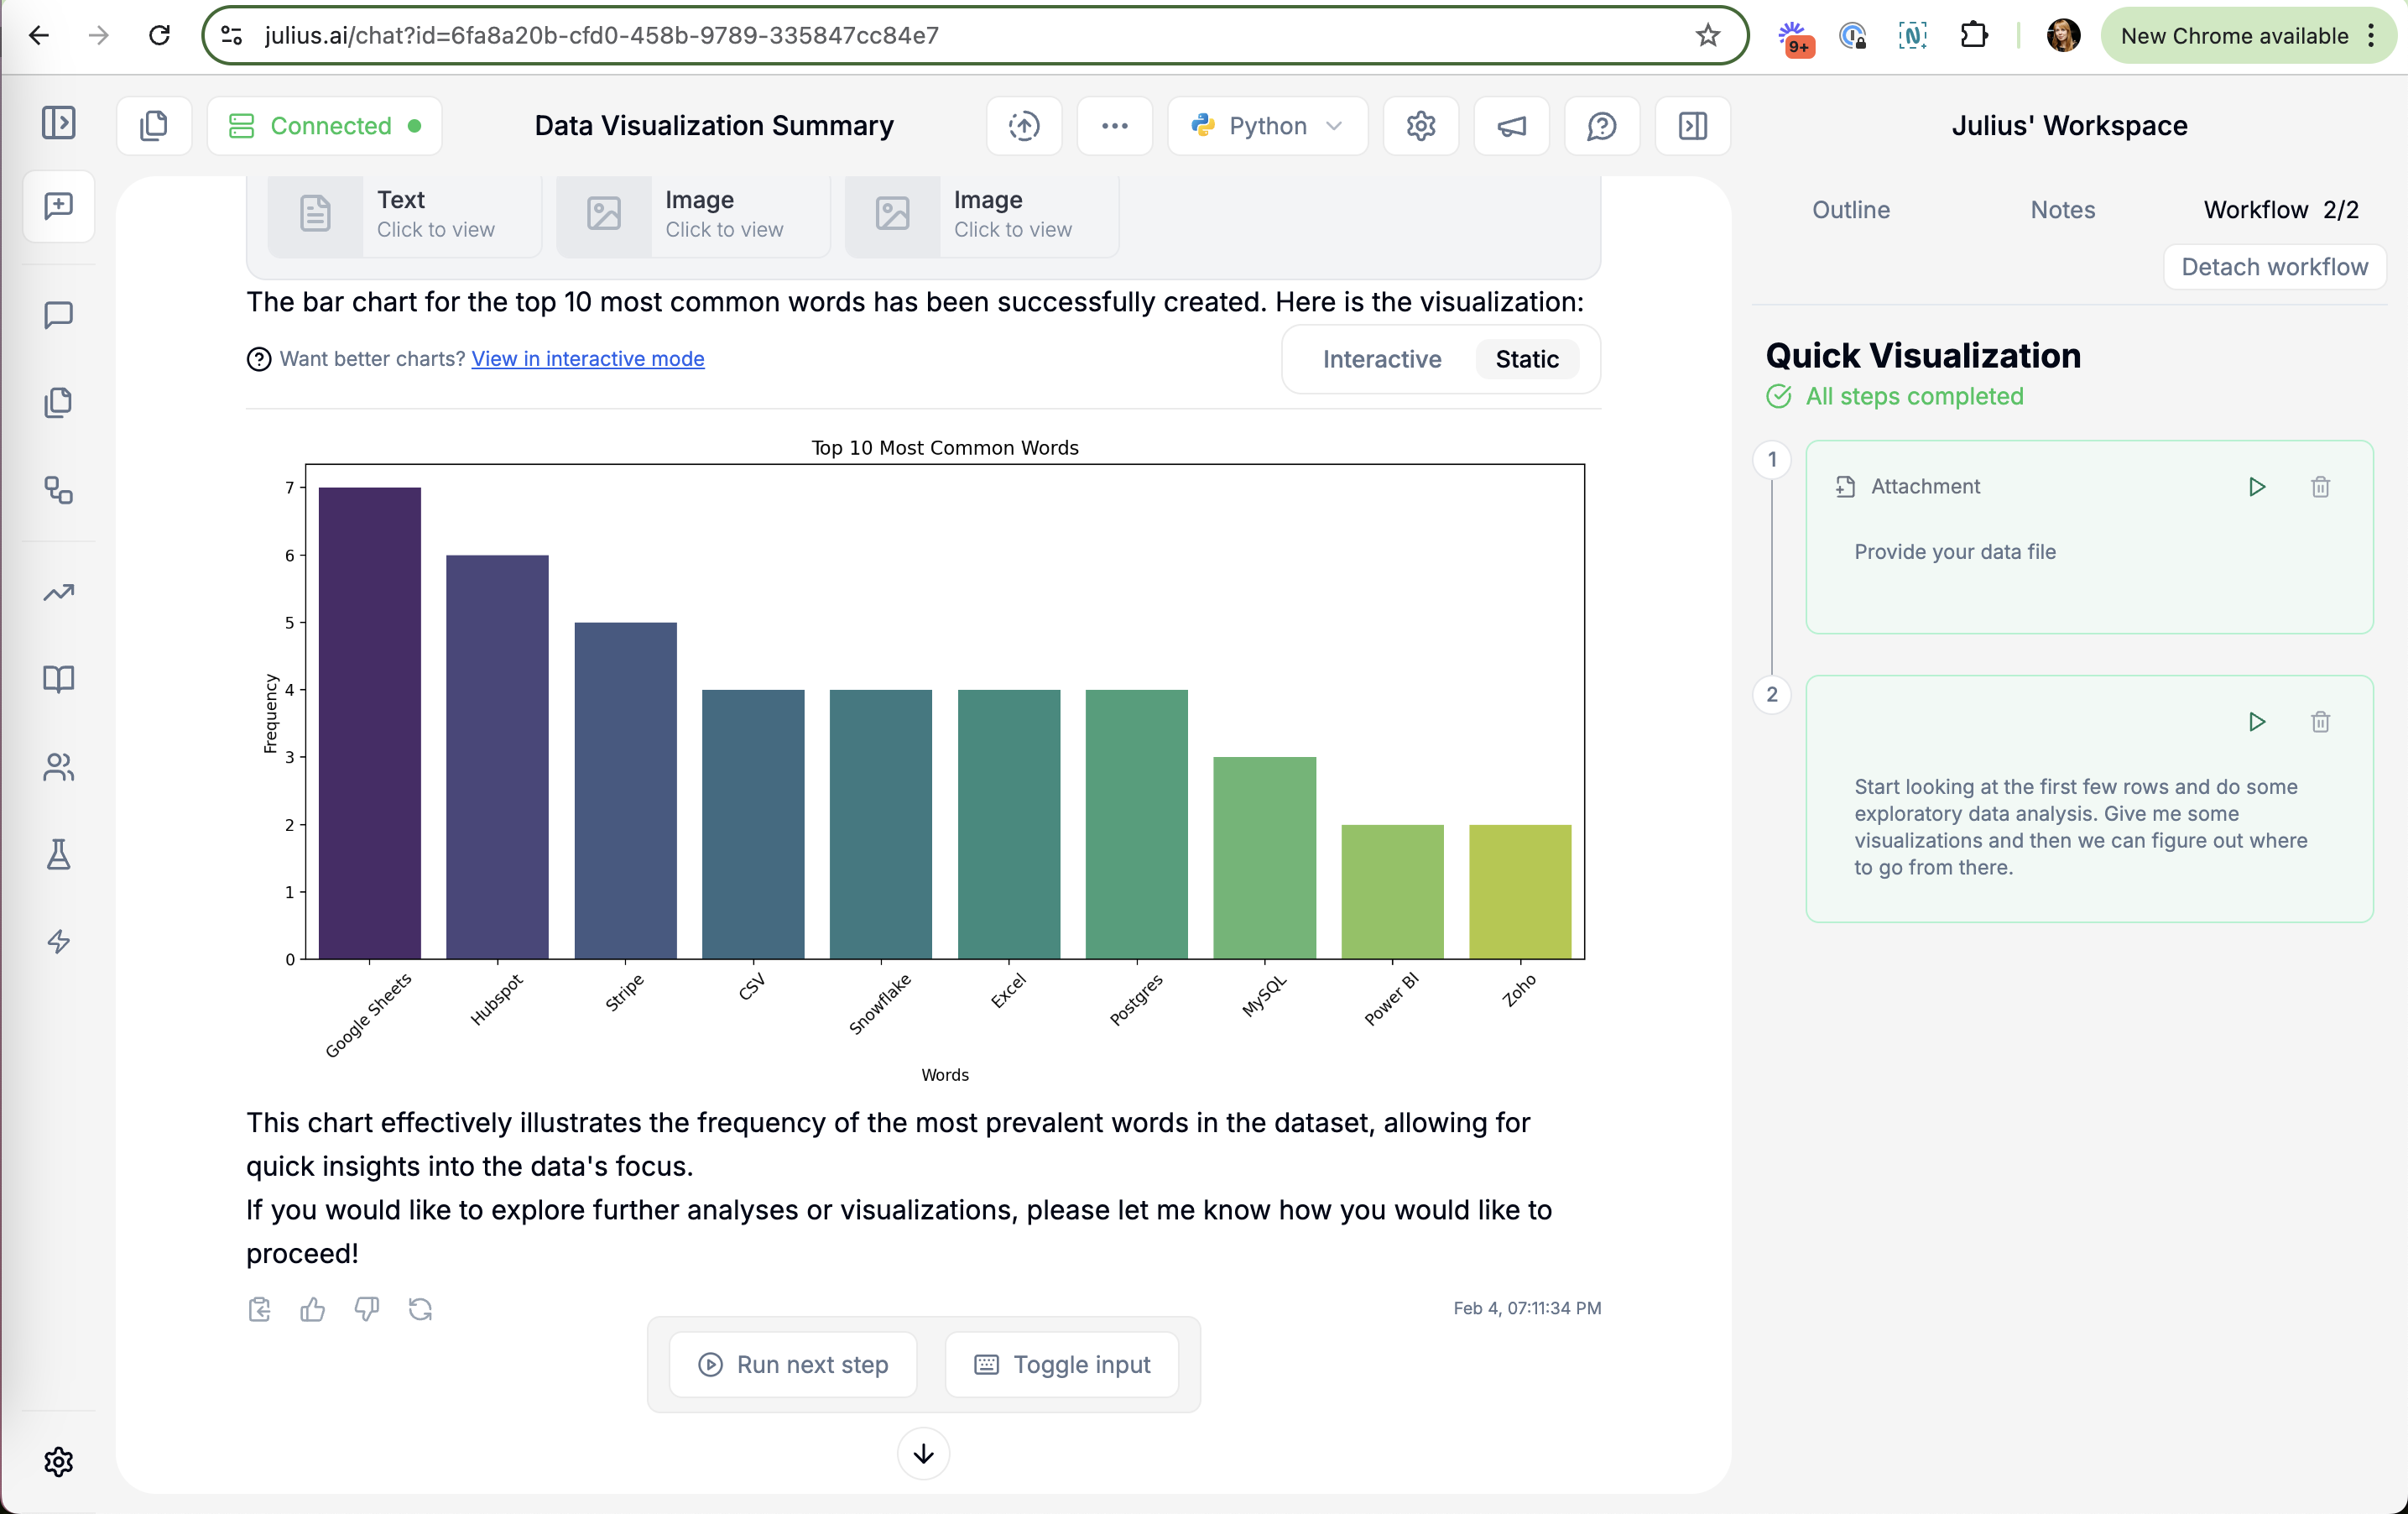
Workflow complete
Julius returns a bar chart, marks both steps done and offers to keep going.
-
26
Nudge to a better chart (working)
"Want better charts? View in interactive mode" points to a richer output right under the result.
-
27
Interactive or static (working)
A toggle lets you switch chart type without re-running anything.
-
28
Filler summary (not working)
"This chart effectively illustrates the frequency of the most prevalent words" restates the chart instead of an insight.
-
29
Run next step after the end (not working)
"Run next step" still shows while the panel says "All steps completed".
-
30
Completion state (working)
"All steps completed" with a green check closes the loop.
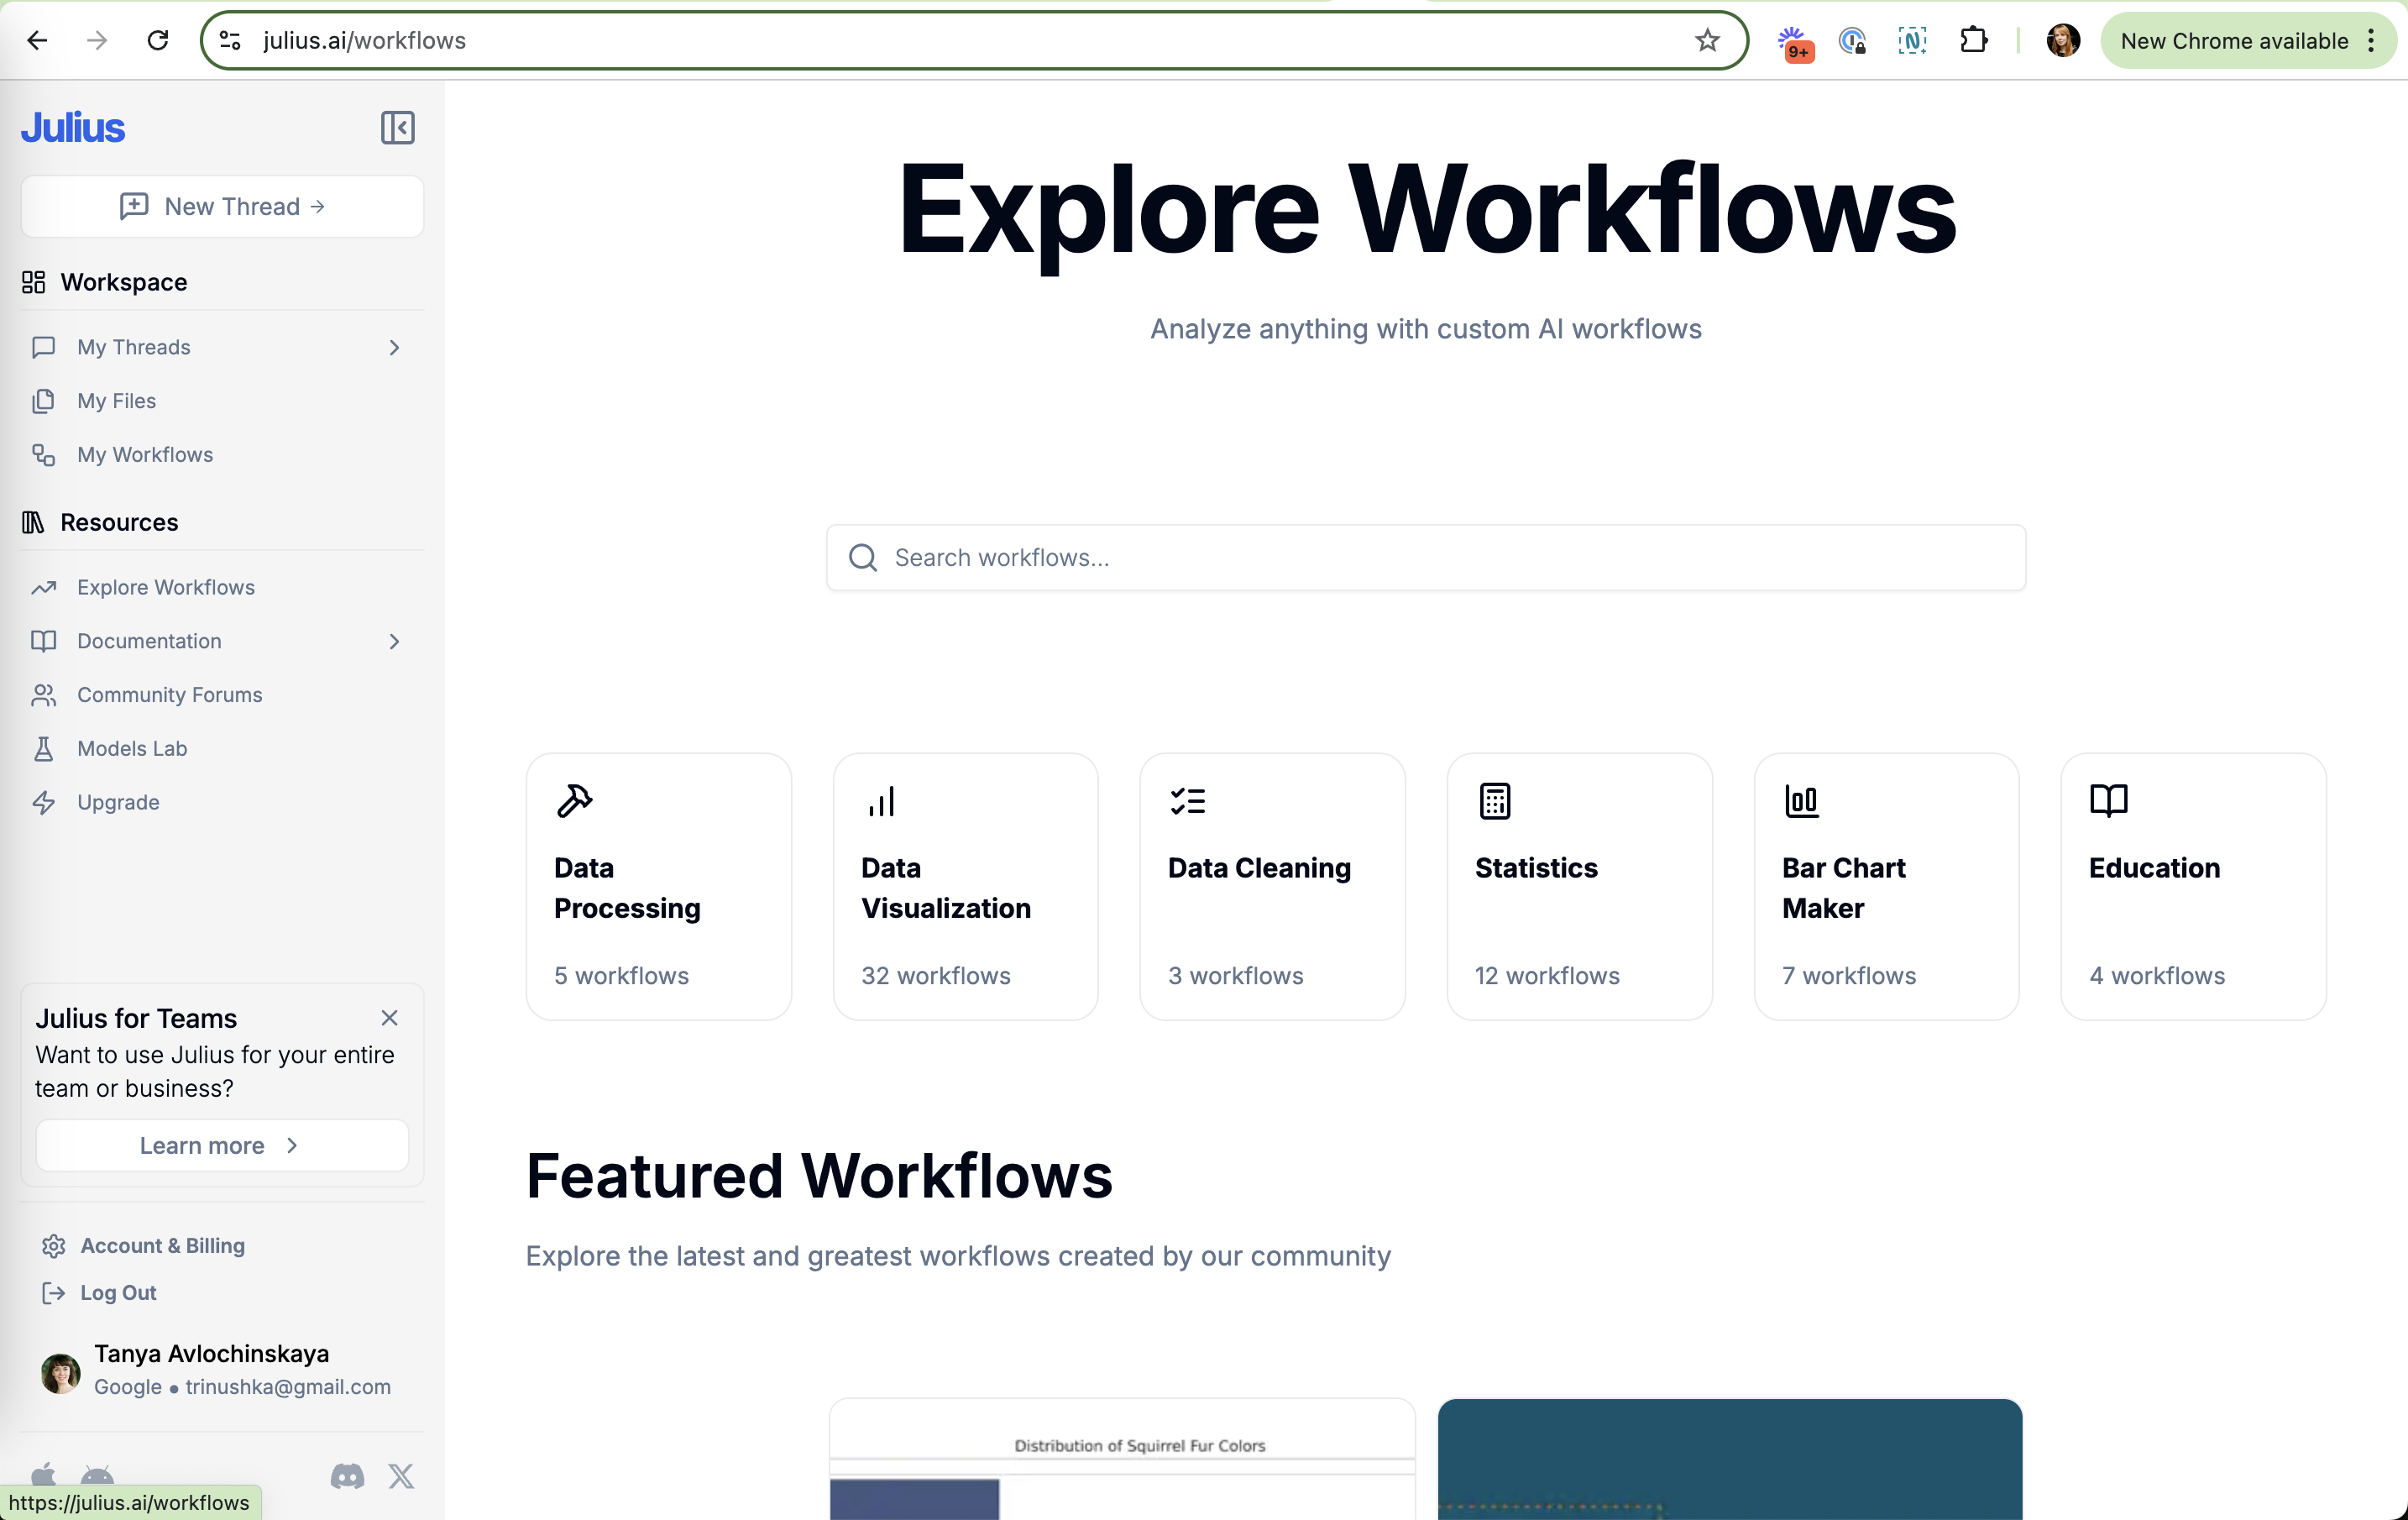
Explore Workflows
The workflow library has its own page with search and categories.
-
31
Search first (working)
A large search box fits people who arrive with a specific chart in mind.
-
32
Categories with counts (working)
"Data Visualization 32 workflows" shows where the depth is.
-
33
Mixed taxonomy (not working)
"Bar Chart Maker" sits next to broad topics like Statistics, a keyword page posing as a category.
-
34
Community-made (working)
"Created by our community" signals the library grows without Julius writing every template.
Category page: Bar Chart Maker
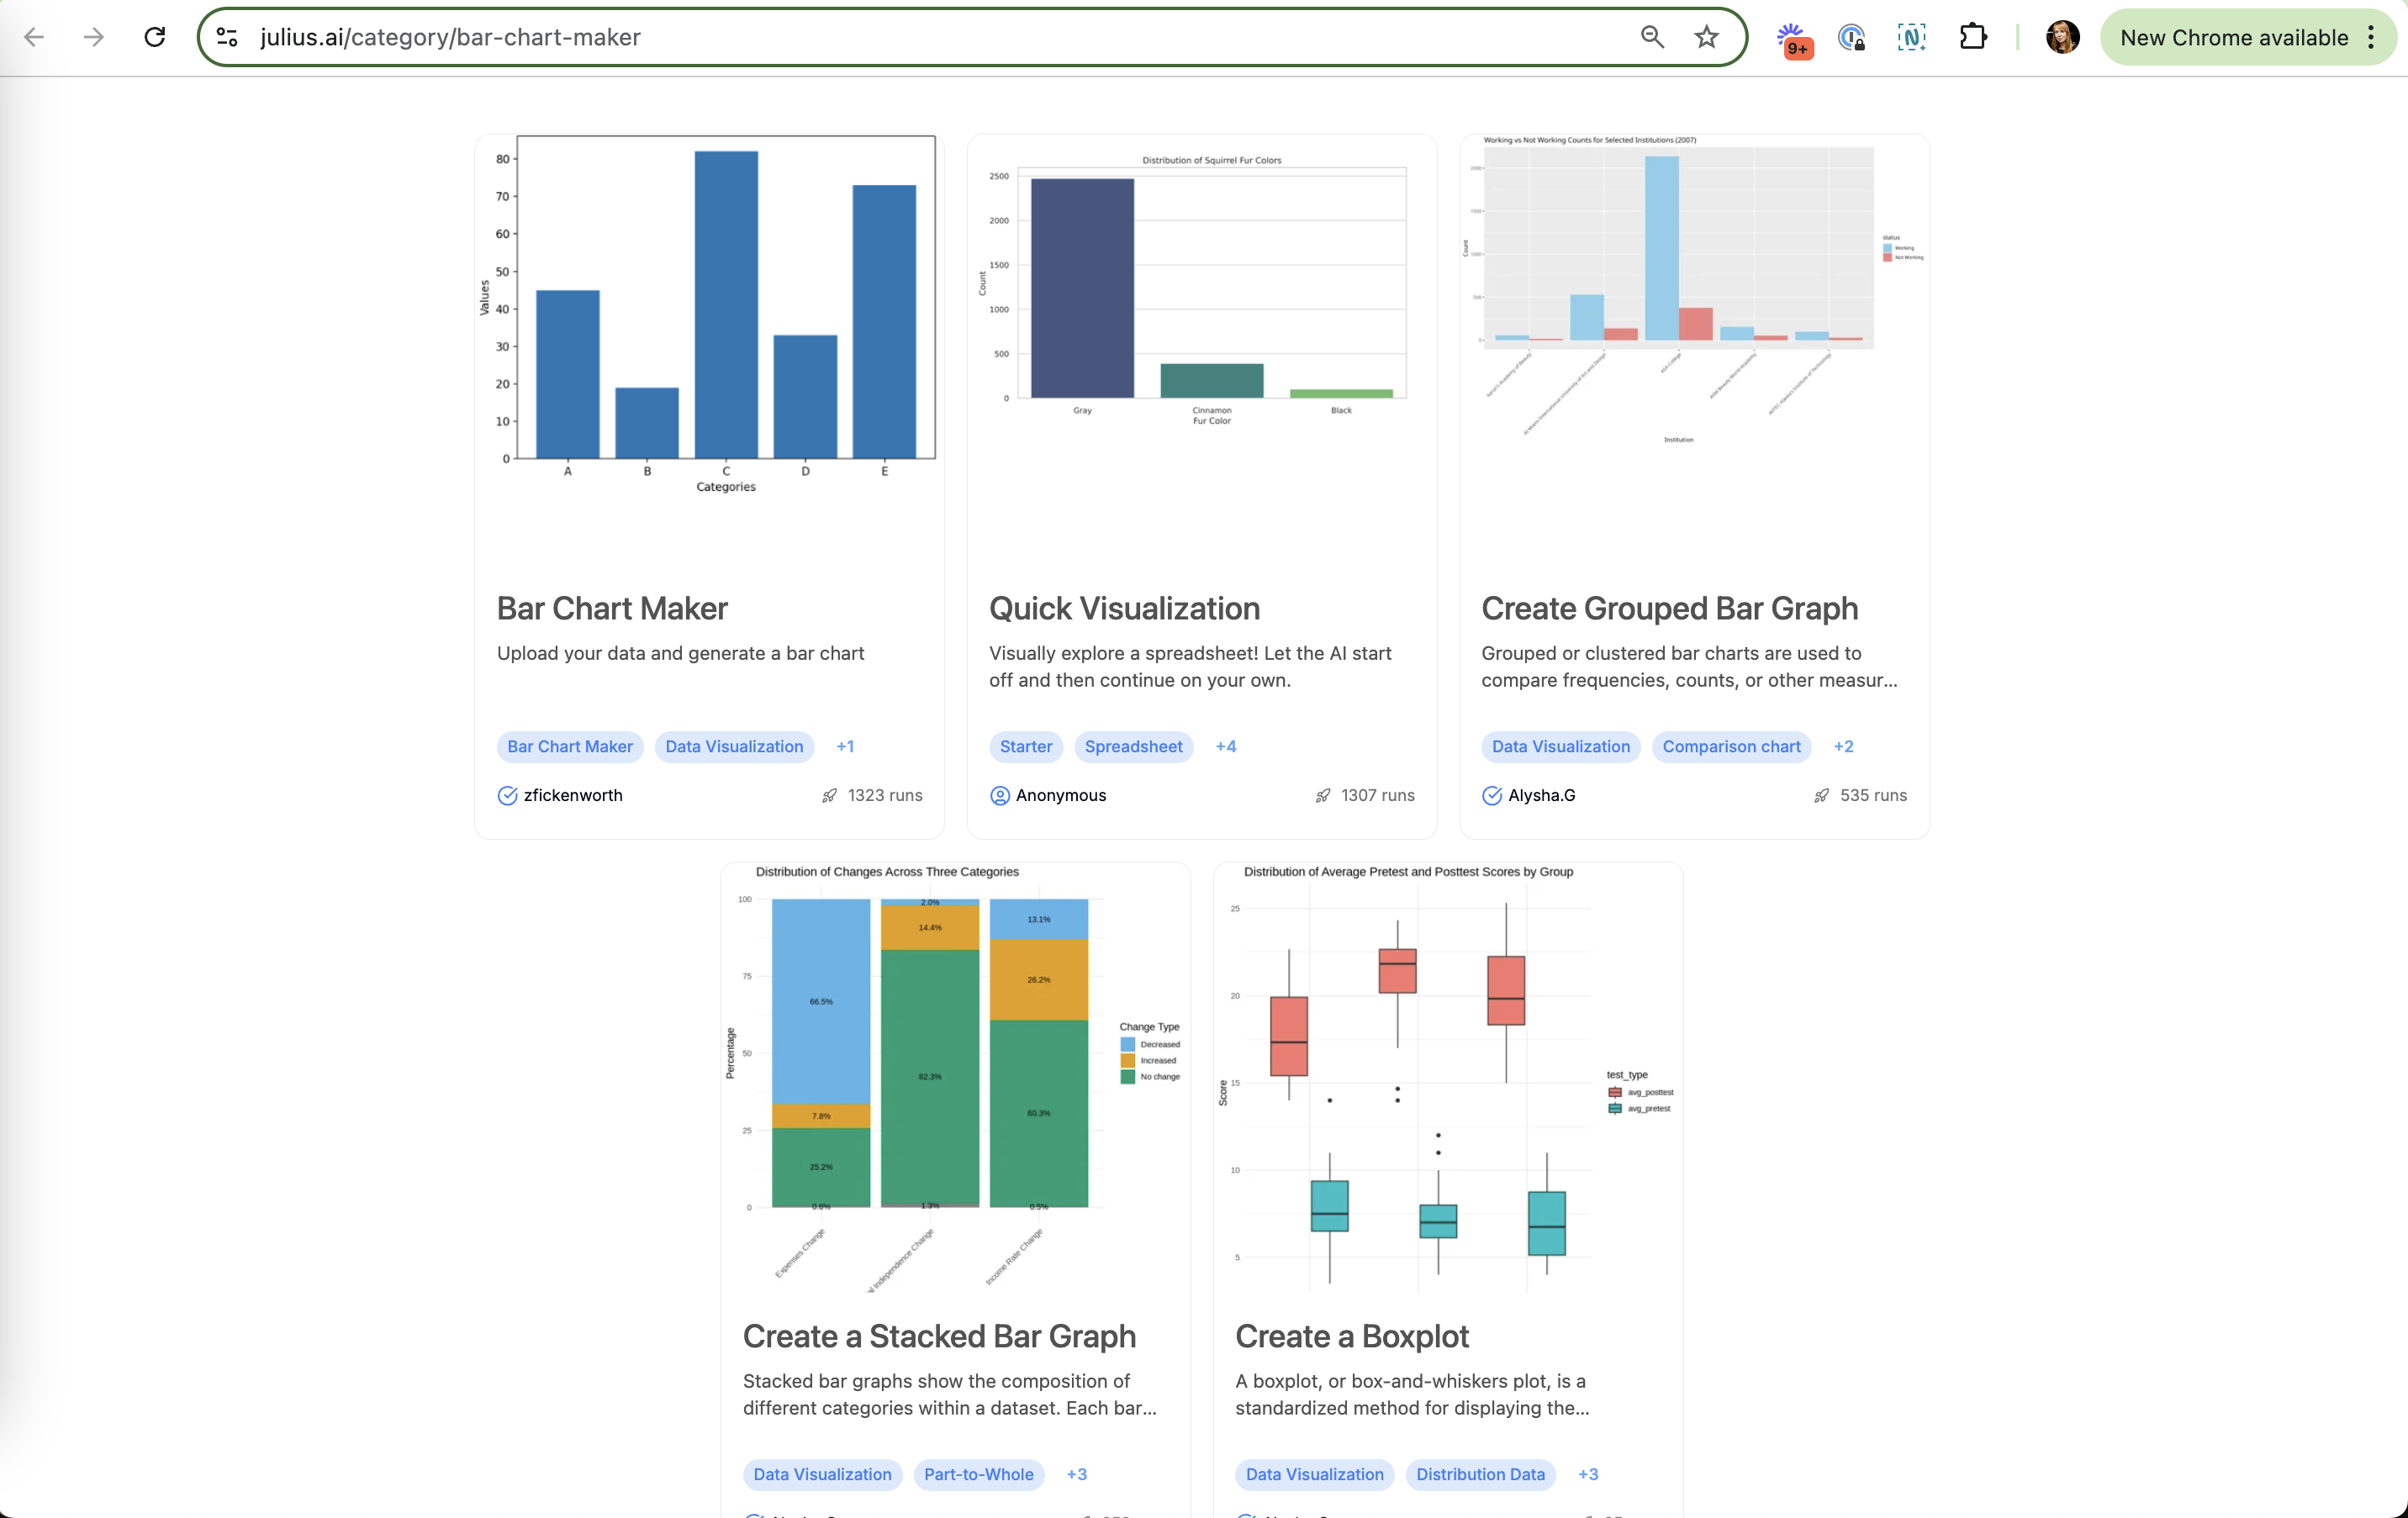
Public category pages, like julius.ai/category/bar-chart-maker, list workflows with real chart thumbnails.
-
35
Keyword URL (working)
/category/bar-chart-maker matches what people type into Google.
-
36
Output as thumbnail (working)
Each card shows the chart it makes, so you browse by result.
-
37
Run counts don't match (not working)
Quick Visualization shows "1307 runs" here and 44267 in the app.
- 38
Category page: Data Visualization
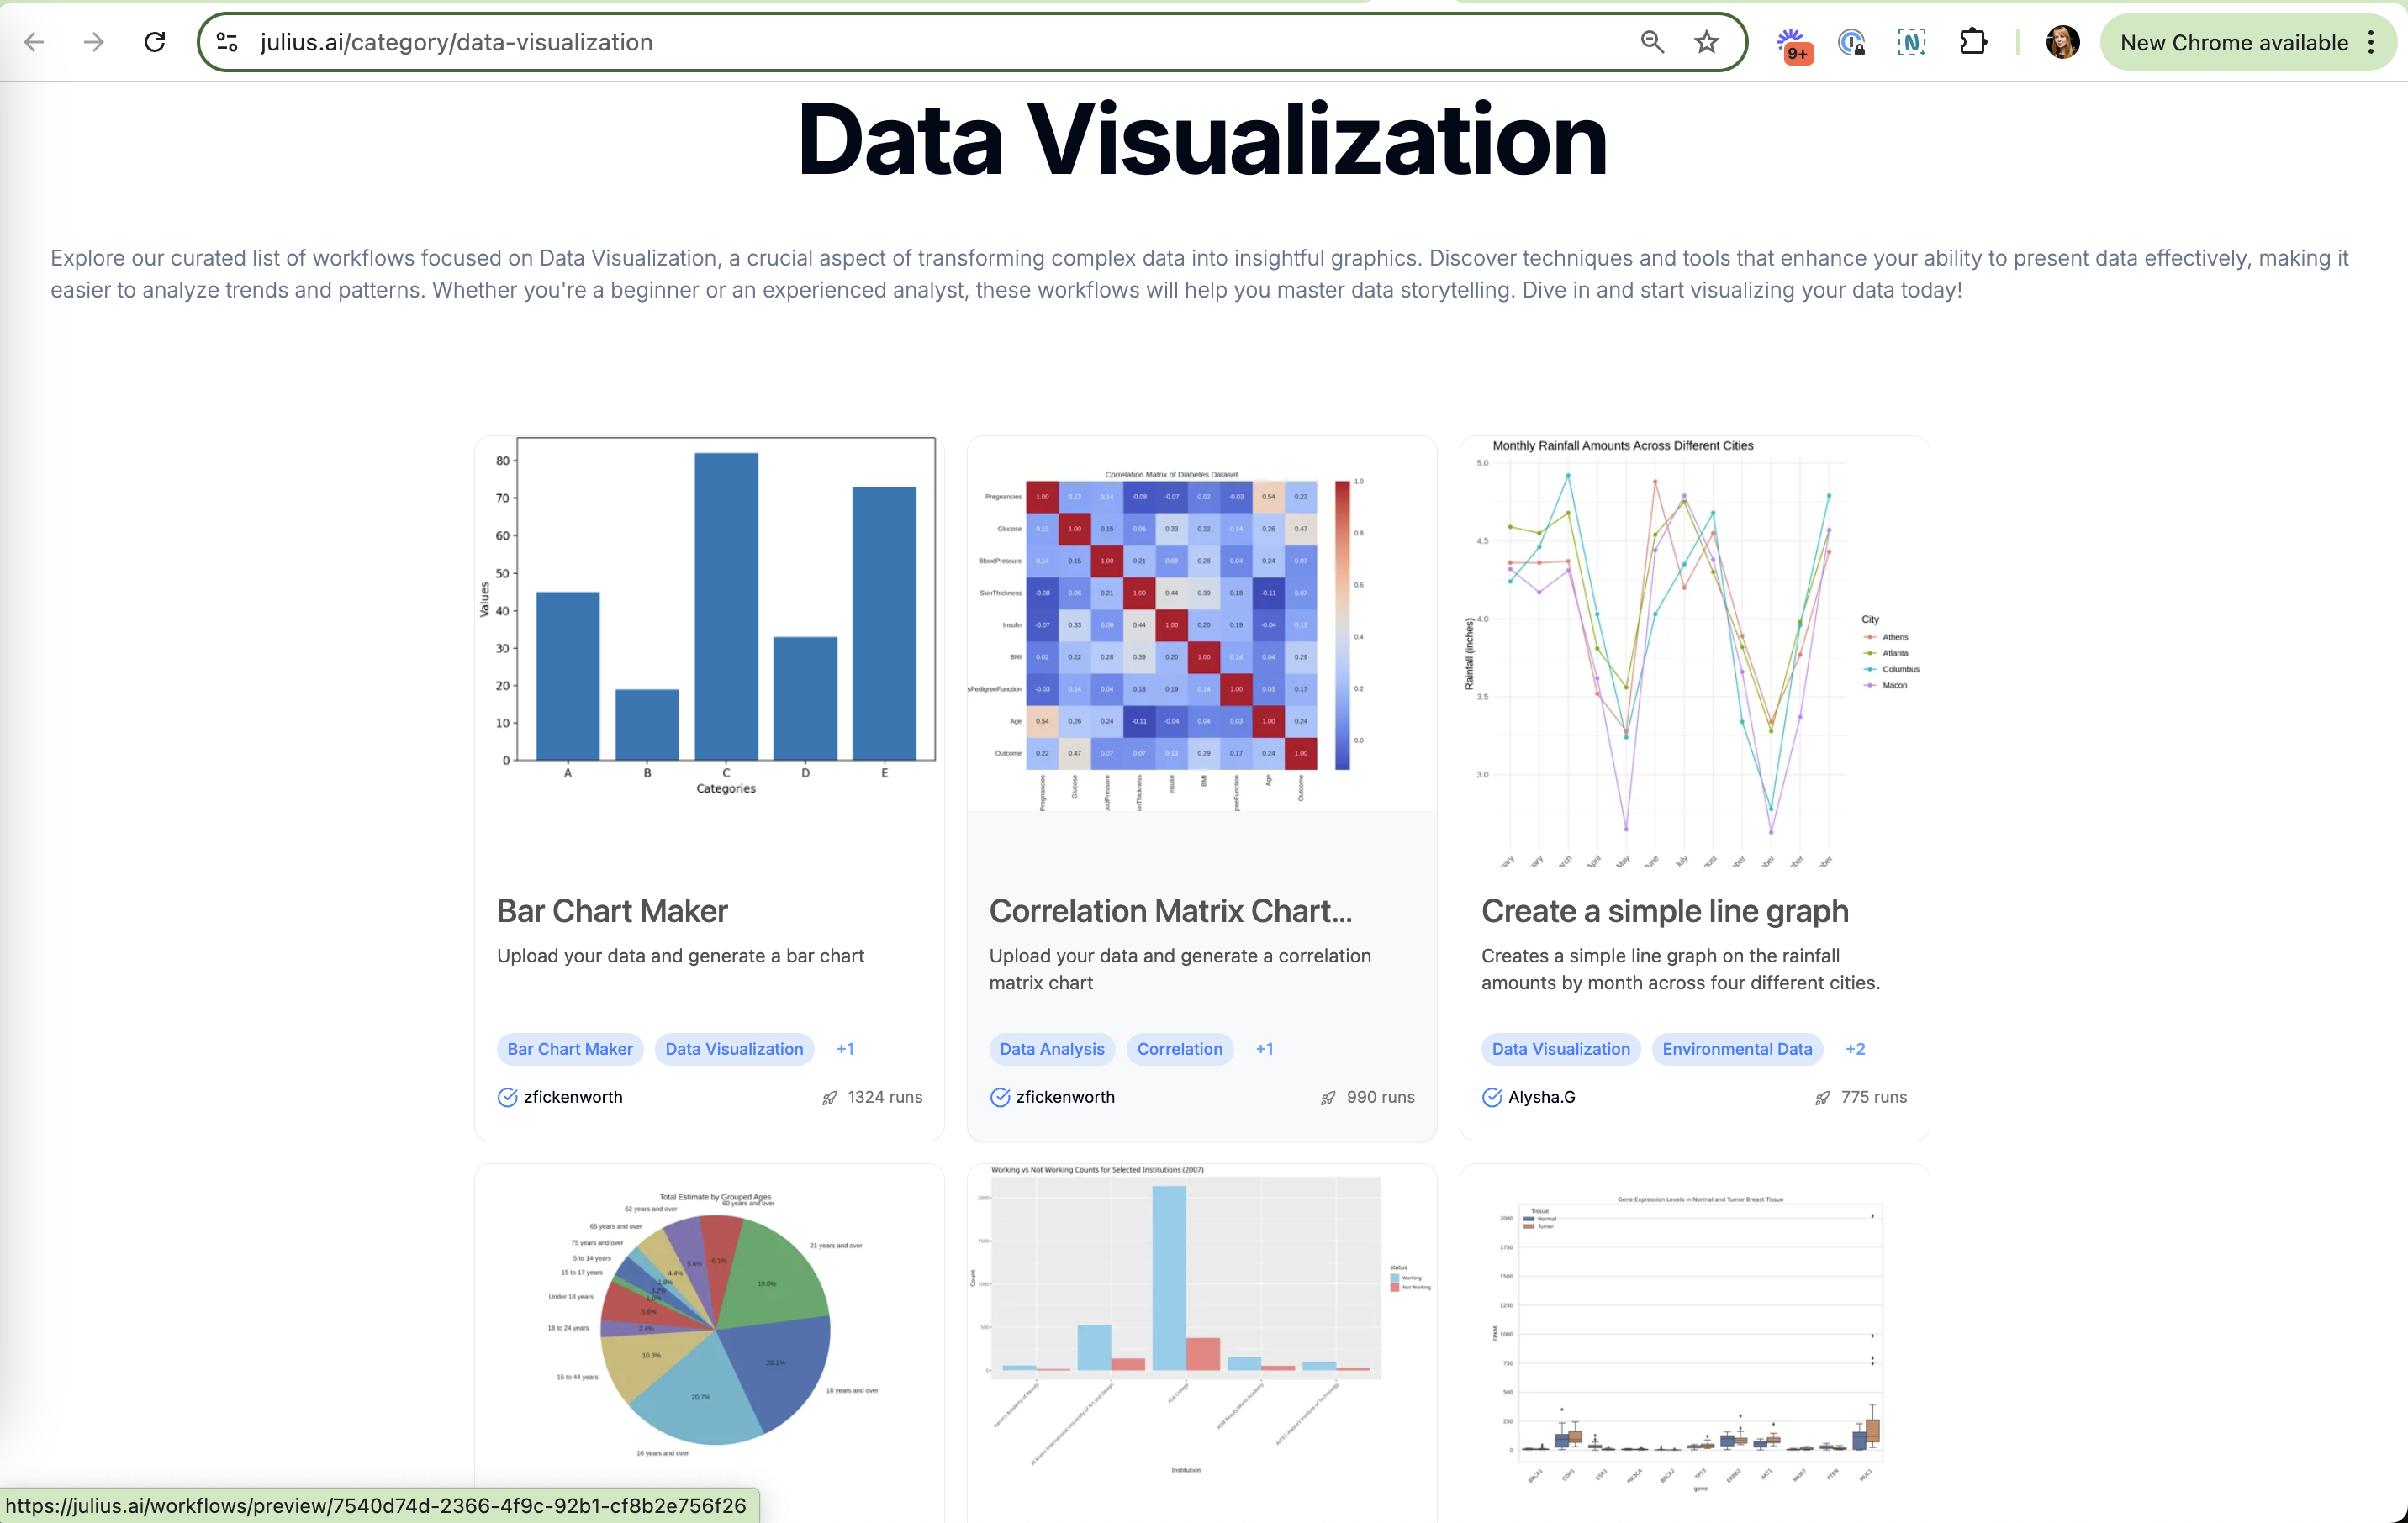
A broader category page in the same template, a gallery of chart types.
-
39
SEO filler intro (not working)
"Dive in and start visualizing your data today!" closes a generic paragraph written for crawlers.
-
40
Gallery of chart types (working)
Bar, correlation matrix, line, pie: you pick the picture you want and the workflow comes with it.
-
41
Shareable preview links (working)
Each card links to its own /workflows/preview page, so a template can be sent around.
Takeaways from Julius
- Package good prompts as named workflows with an example output and visible steps, so new users start from a result, not a blank box.
- Offer sample data next to upload so people can see the workflow work before trusting it with their own file.
- Publish templates as keyword category pages to turn your library into an acquisition channel, and keep stats consistent across both.