Usability heuristic

Show, don't tell

Let people see or try the product's result, with examples, previews or demo data, instead of describing features in words.

Show, don't tell Two first screens of a data product. One is a carousel slide that claims powerful AI insights. The other already shows a sample question, a chart as the answer and example prompts to tap. The real result explains the product faster than the claim. Tells: a slide of claims Powerful AI insights Unlock the full potential of your data Next Often skipped, and tasks go no better Shows: a real result to try Sales by month? JanFebMarAprMay Tap to try: Top customers Churn this quarter One real result beats a list of claims
A carousel slide that claims powerful insights tells; a first screen with a sample question, a chart answer and example prompts to tap shows what the product does.

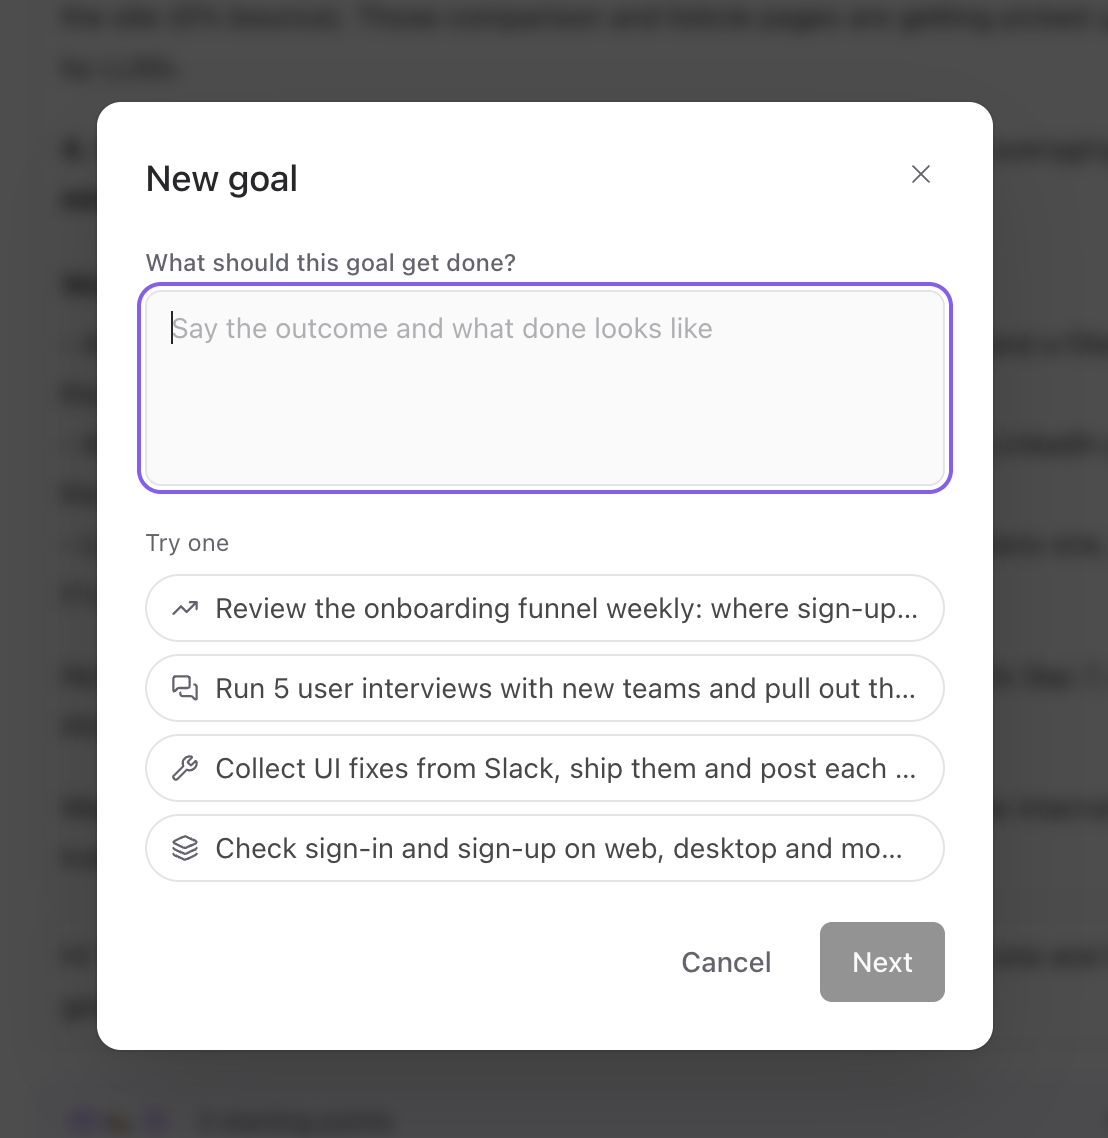
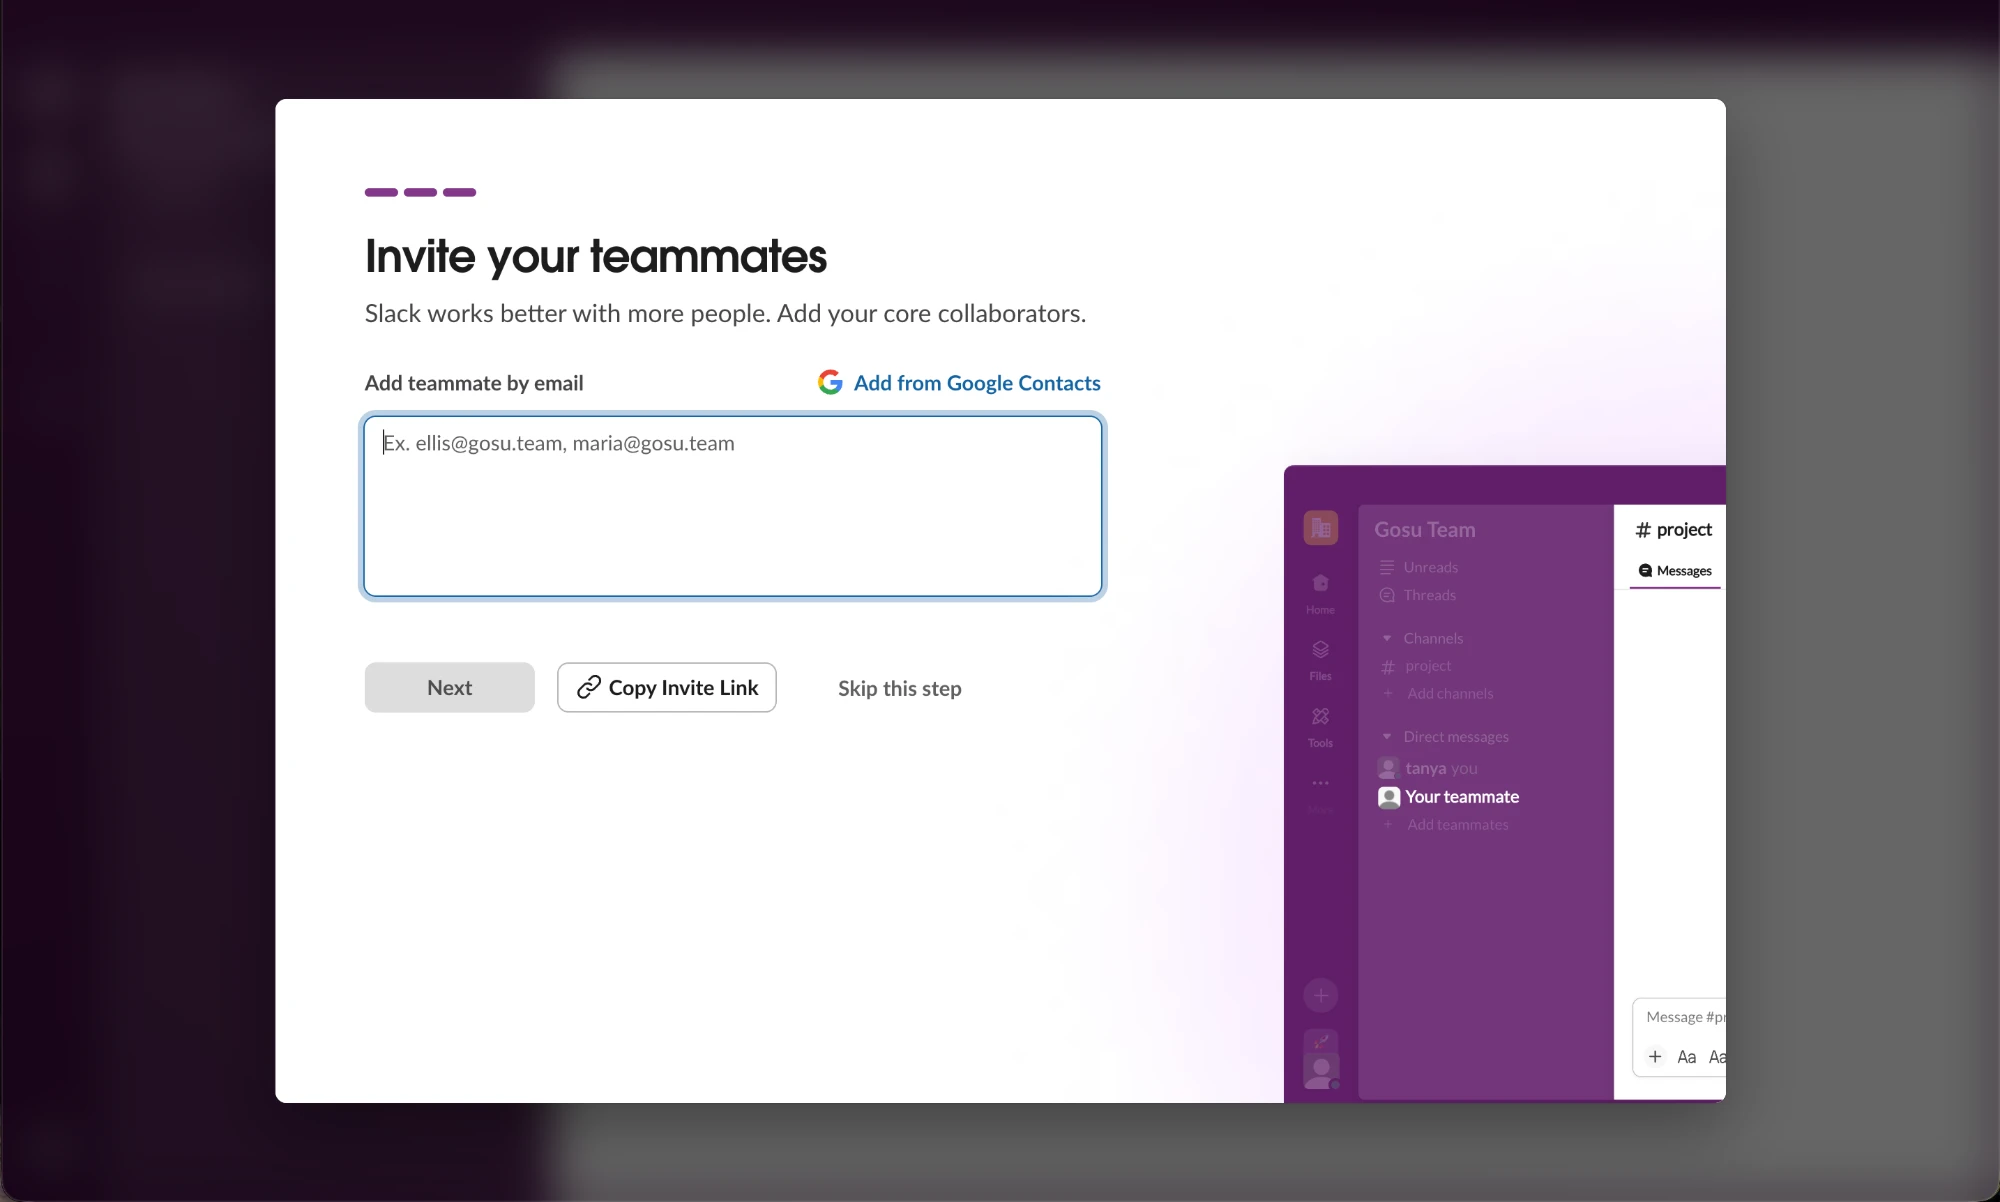
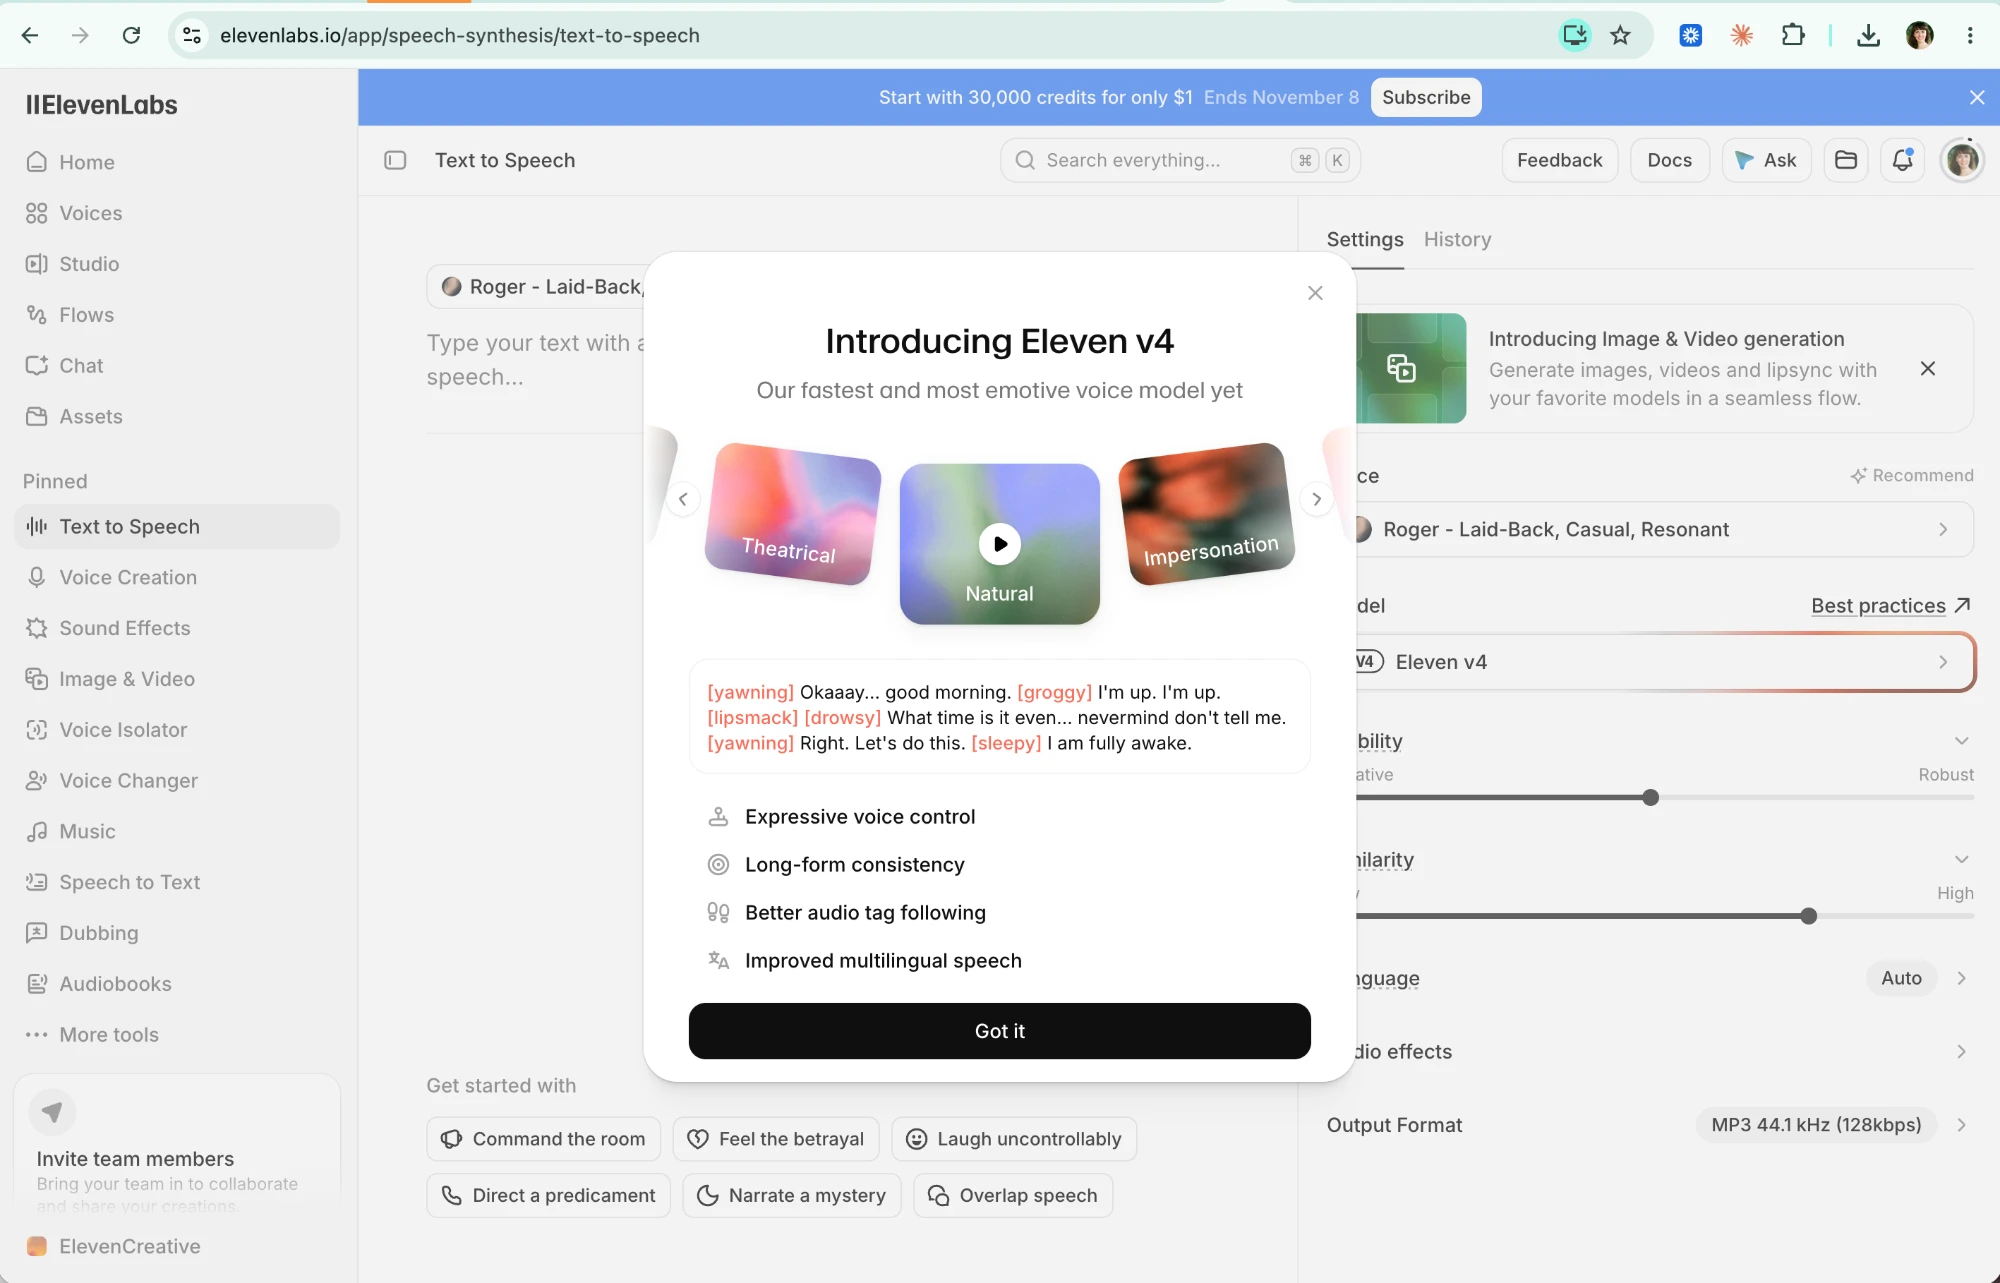
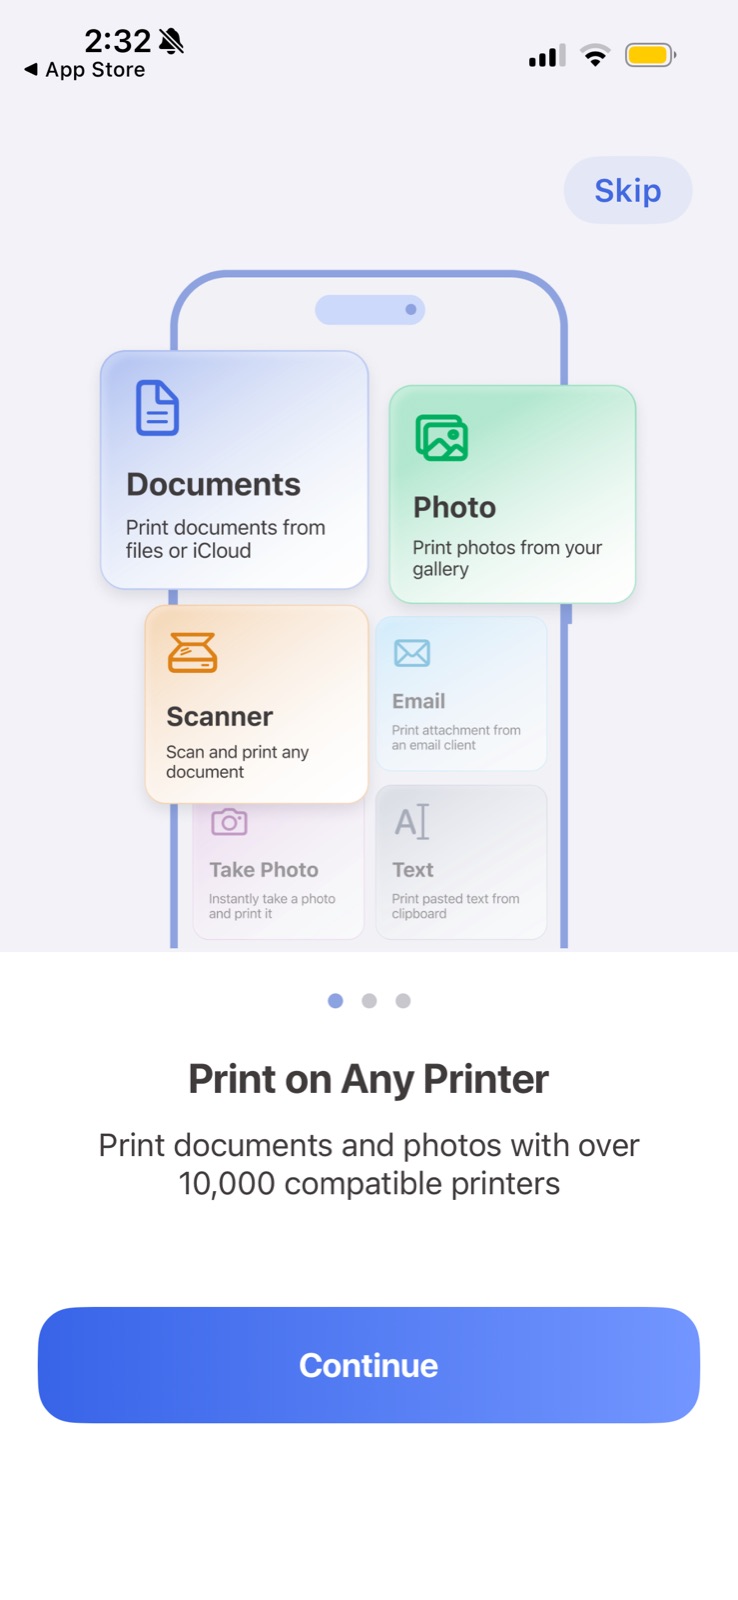
Show, don't tell means replacing a description of value with the thing itself: a sample answer, a live preview of the workspace, an example goal you can tap, a playable voice style. People judge a product faster from one concrete example than from a list of features, and examples double as instructions for what good input looks like.

Nielsen Norman Group's research on mobile onboarding found that deck-of-cards tutorials shown at launch did not improve task performance and were often skipped; brief interactive walkthroughs that let people learn by doing worked better. A later NN/g article on tutorials versus contextual help makes the same point: help pushed out of context interrupts and is forgotten, while help shown at the moment of use sticks.

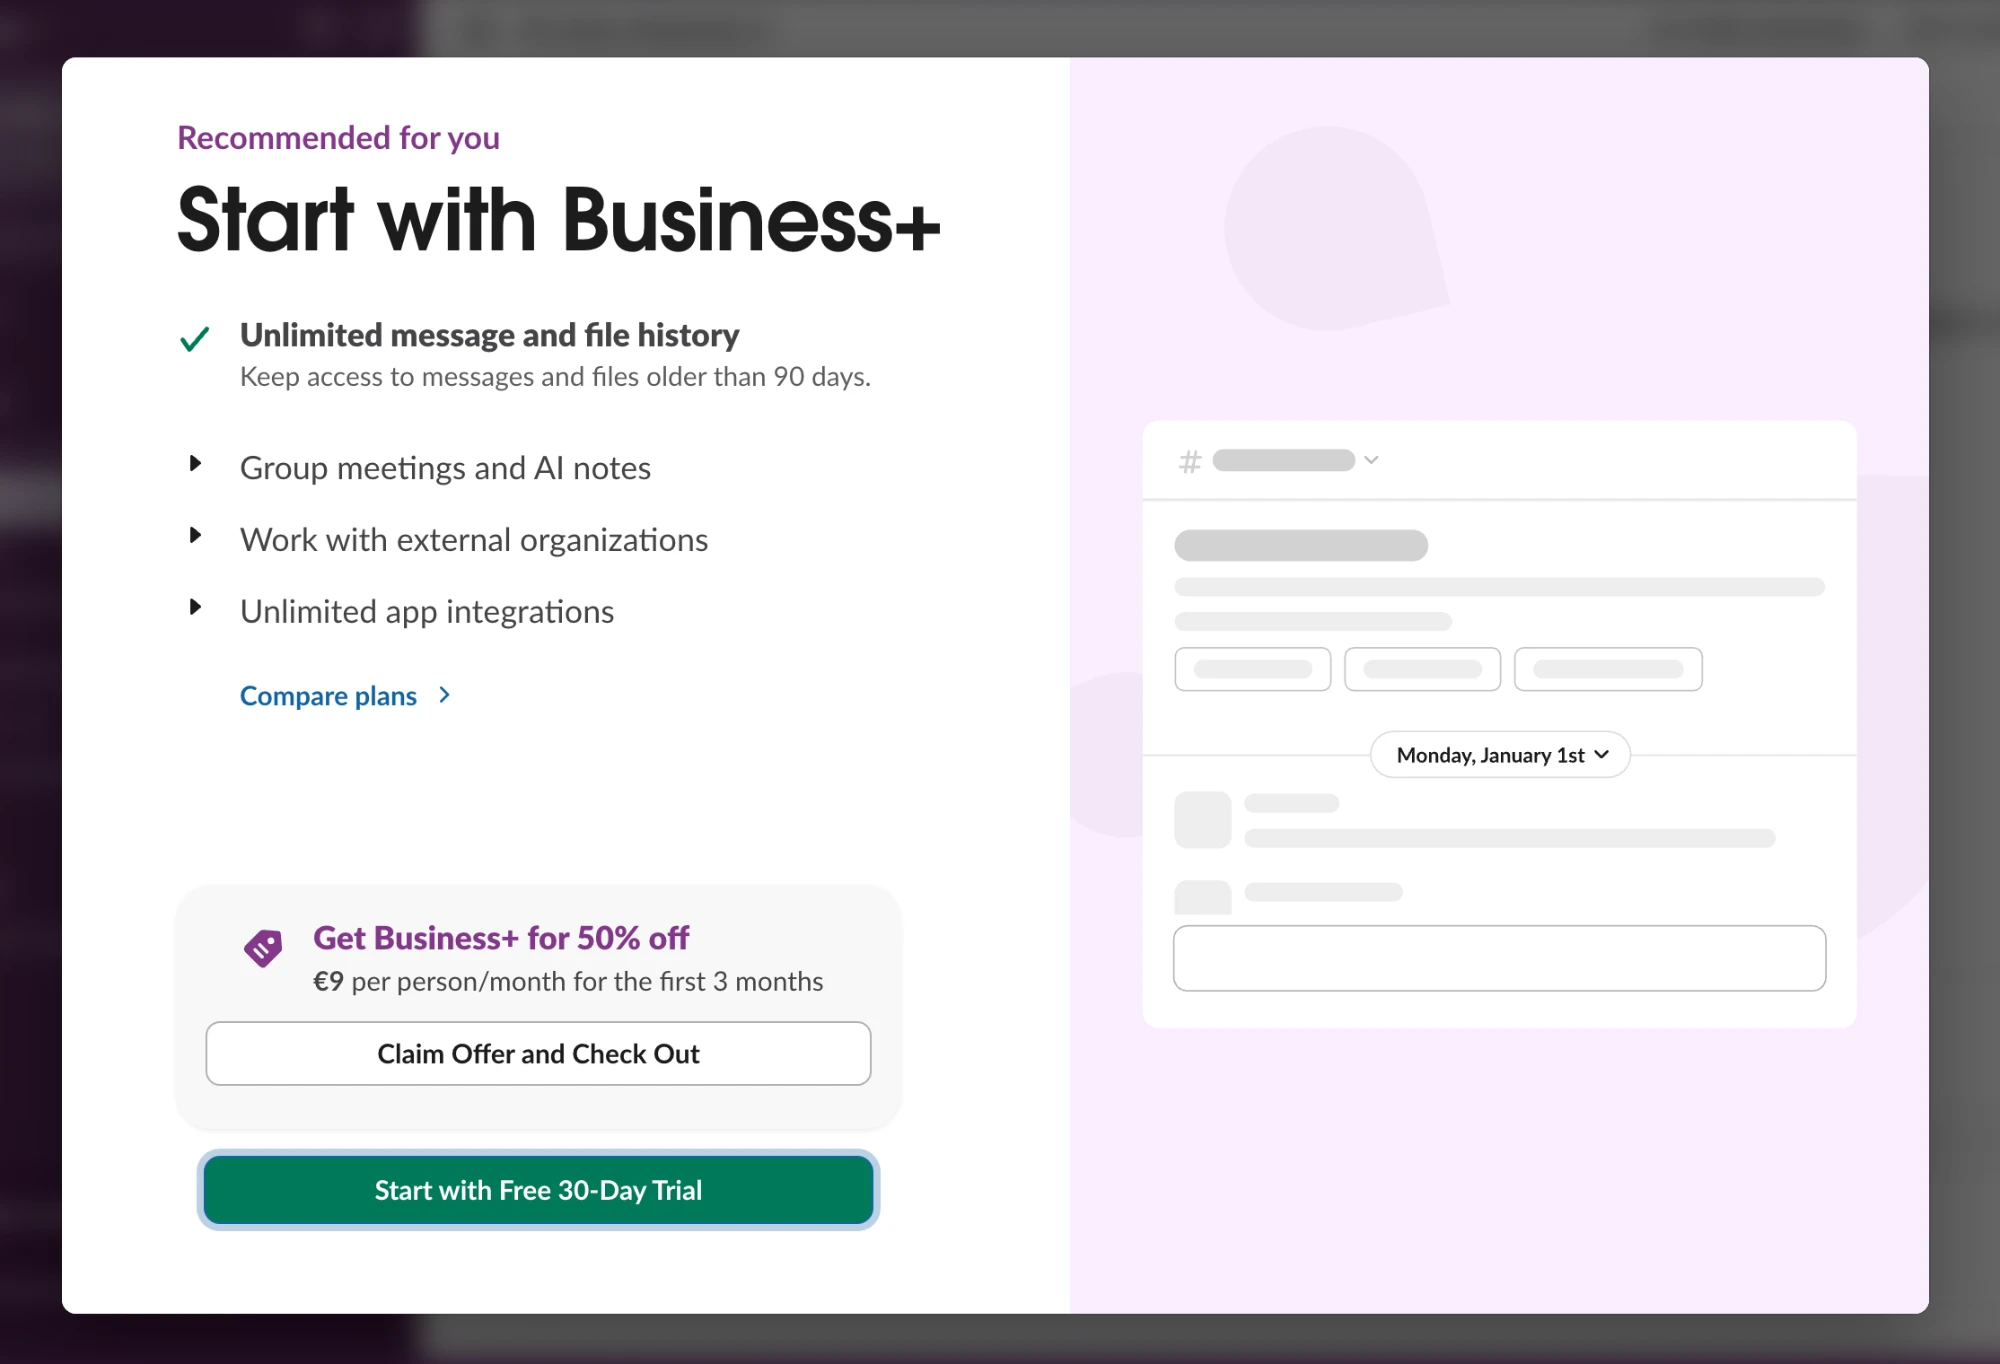
In onboarding this is the difference between a carousel of claims and a screen that already contains a realistic result. On a paywall or upsell it means previewing what the paid tier looks like with the user's own content rather than repeating a feature list. Empty placeholders and skeletons in an upsell are a missed chance to show the payoff.

How to use it

  • Open onboarding with a real-looking example of the output (a sample answer, a filled-in dashboard) before any explanation.
  • Offer one-tap example inputs (chips, templates, demo data) so users see what good input looks like and get a result immediately.
  • In upsells, preview the paid feature applied to the user's own data or a realistic sample, not a generic placeholder.

Watch out

  • Demo content that is unrealistically polished or misrepresents what the product can actually do sets up disappointment.
  • Examples that pull users toward a use case they didn't come for (for example, a shopping example in a to-do app) confuse what the product is.

Related

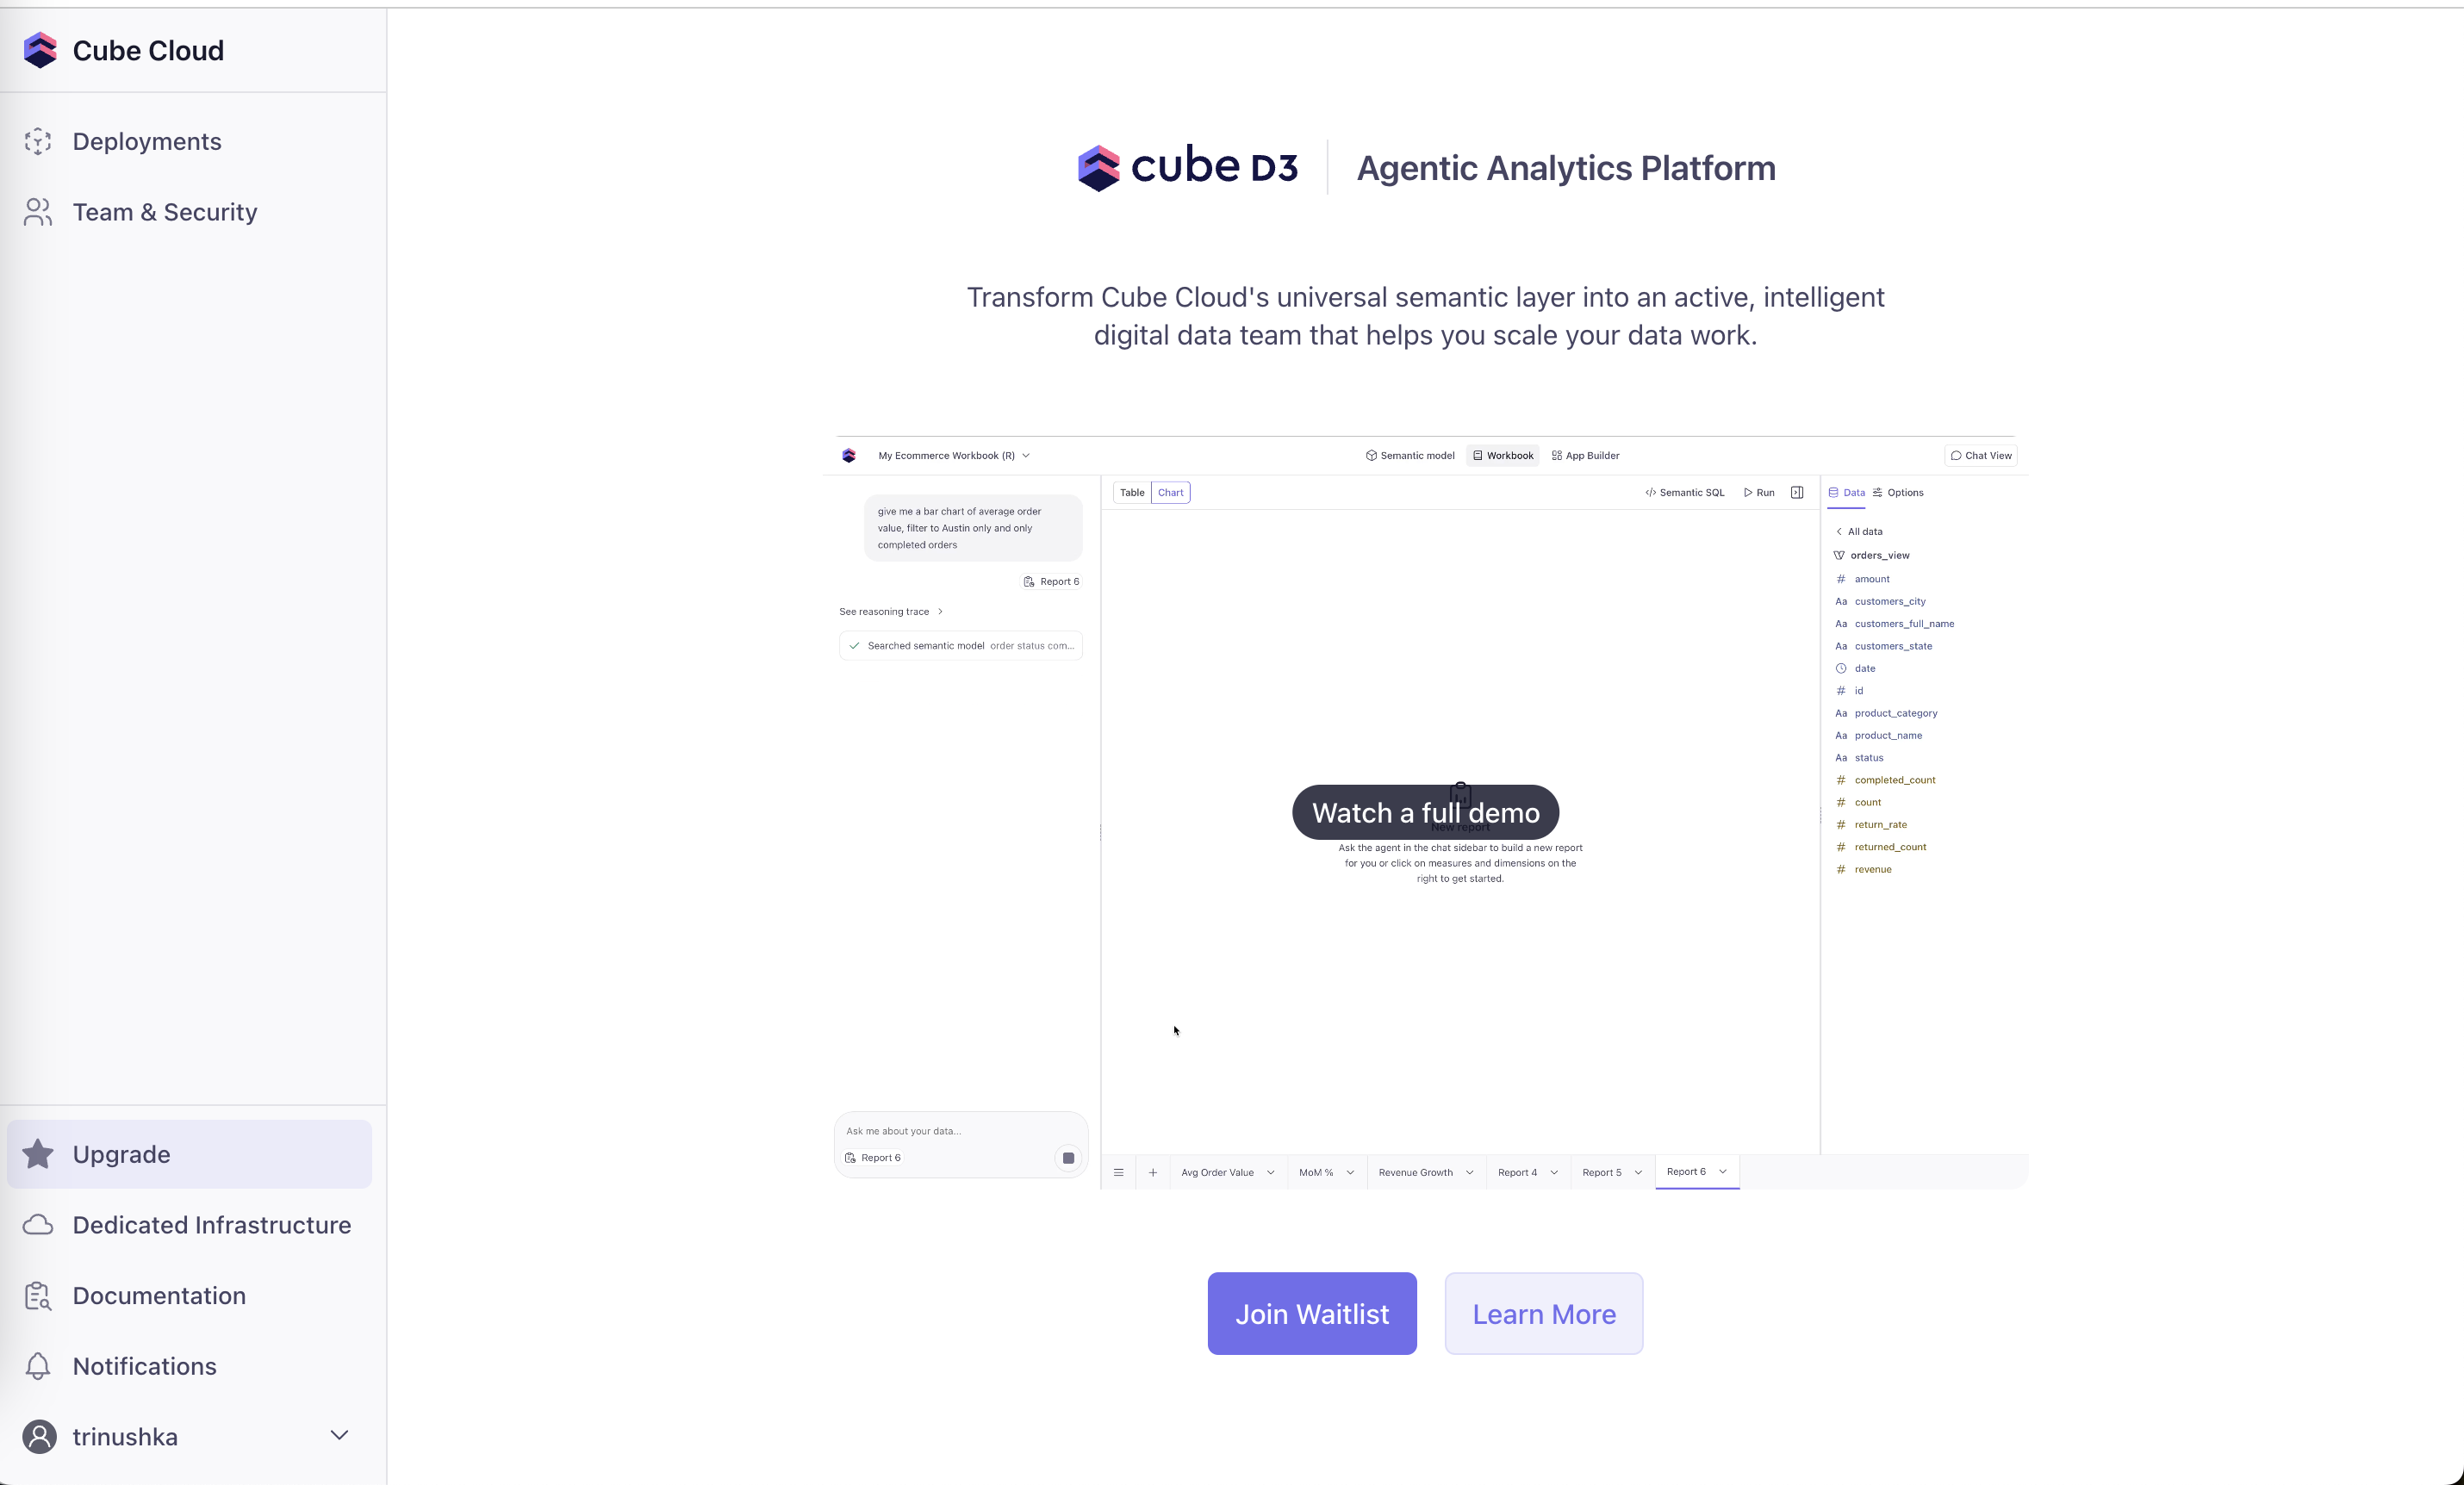
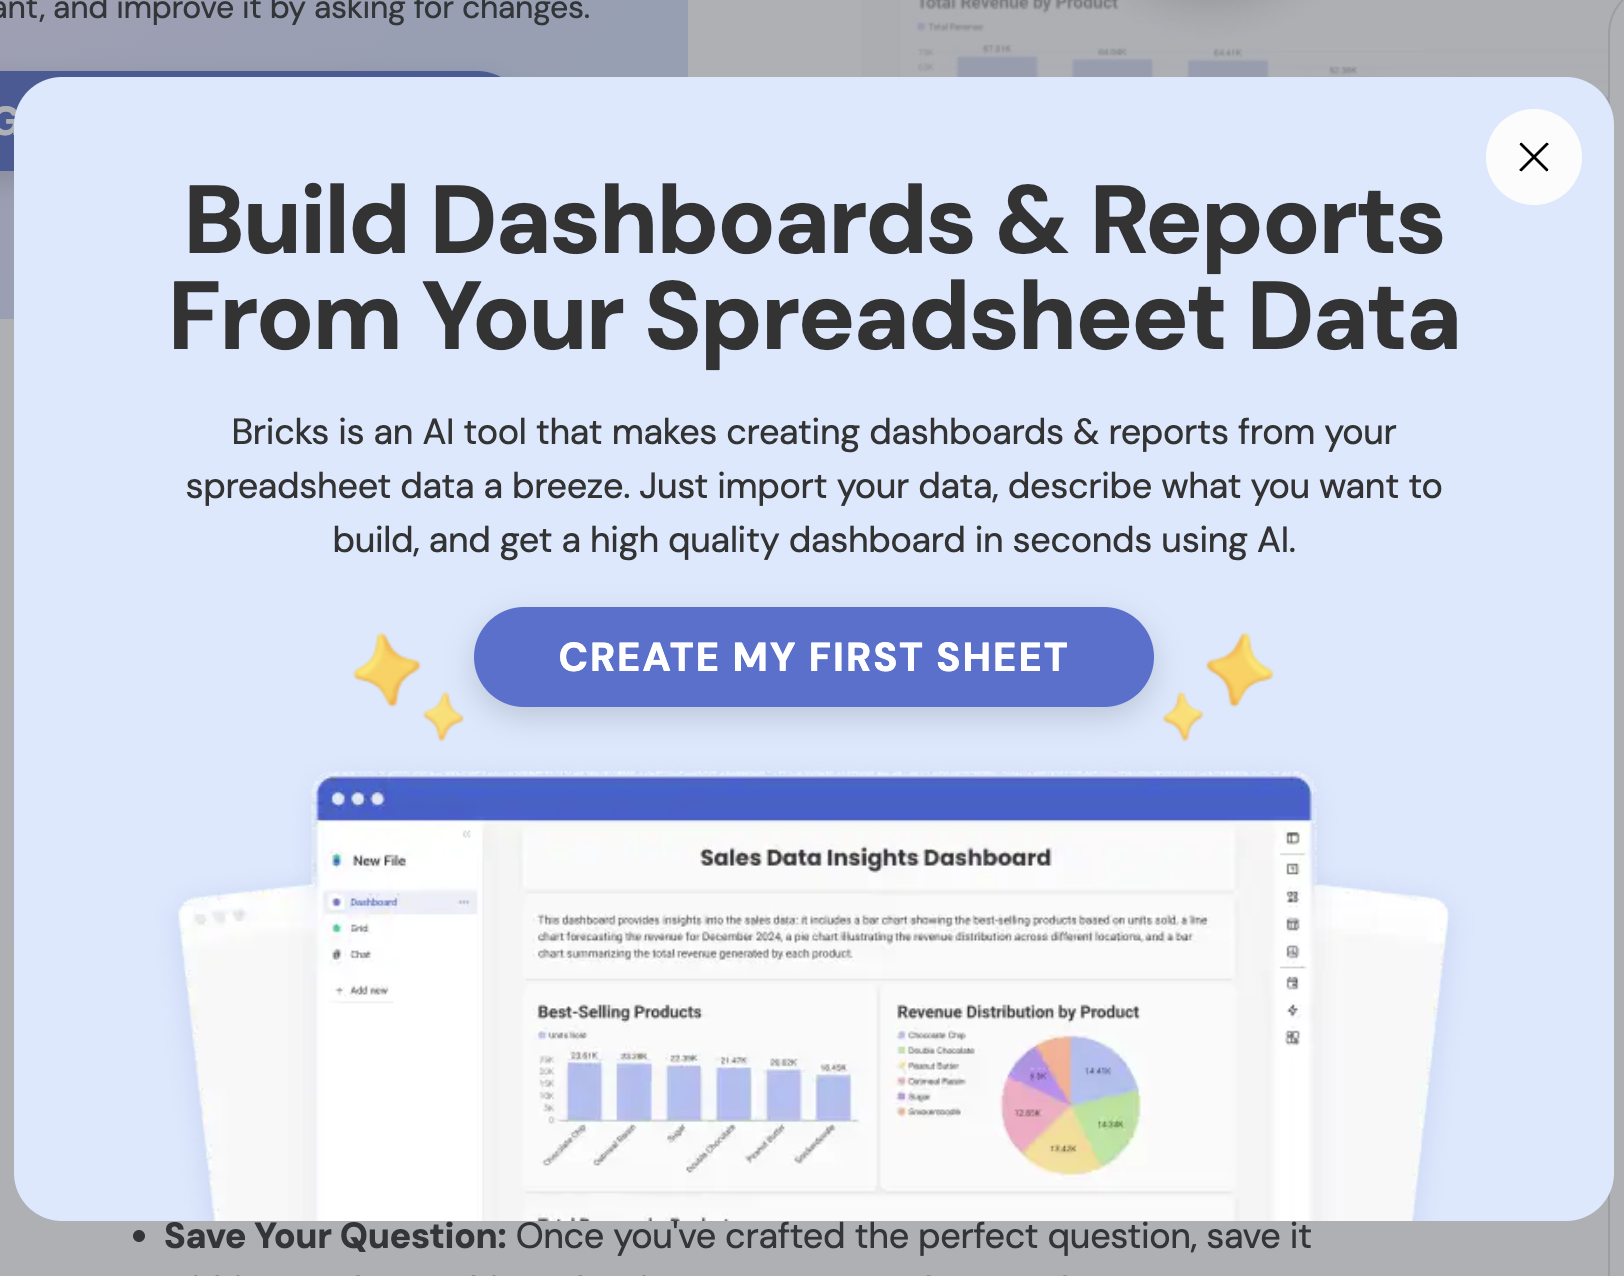
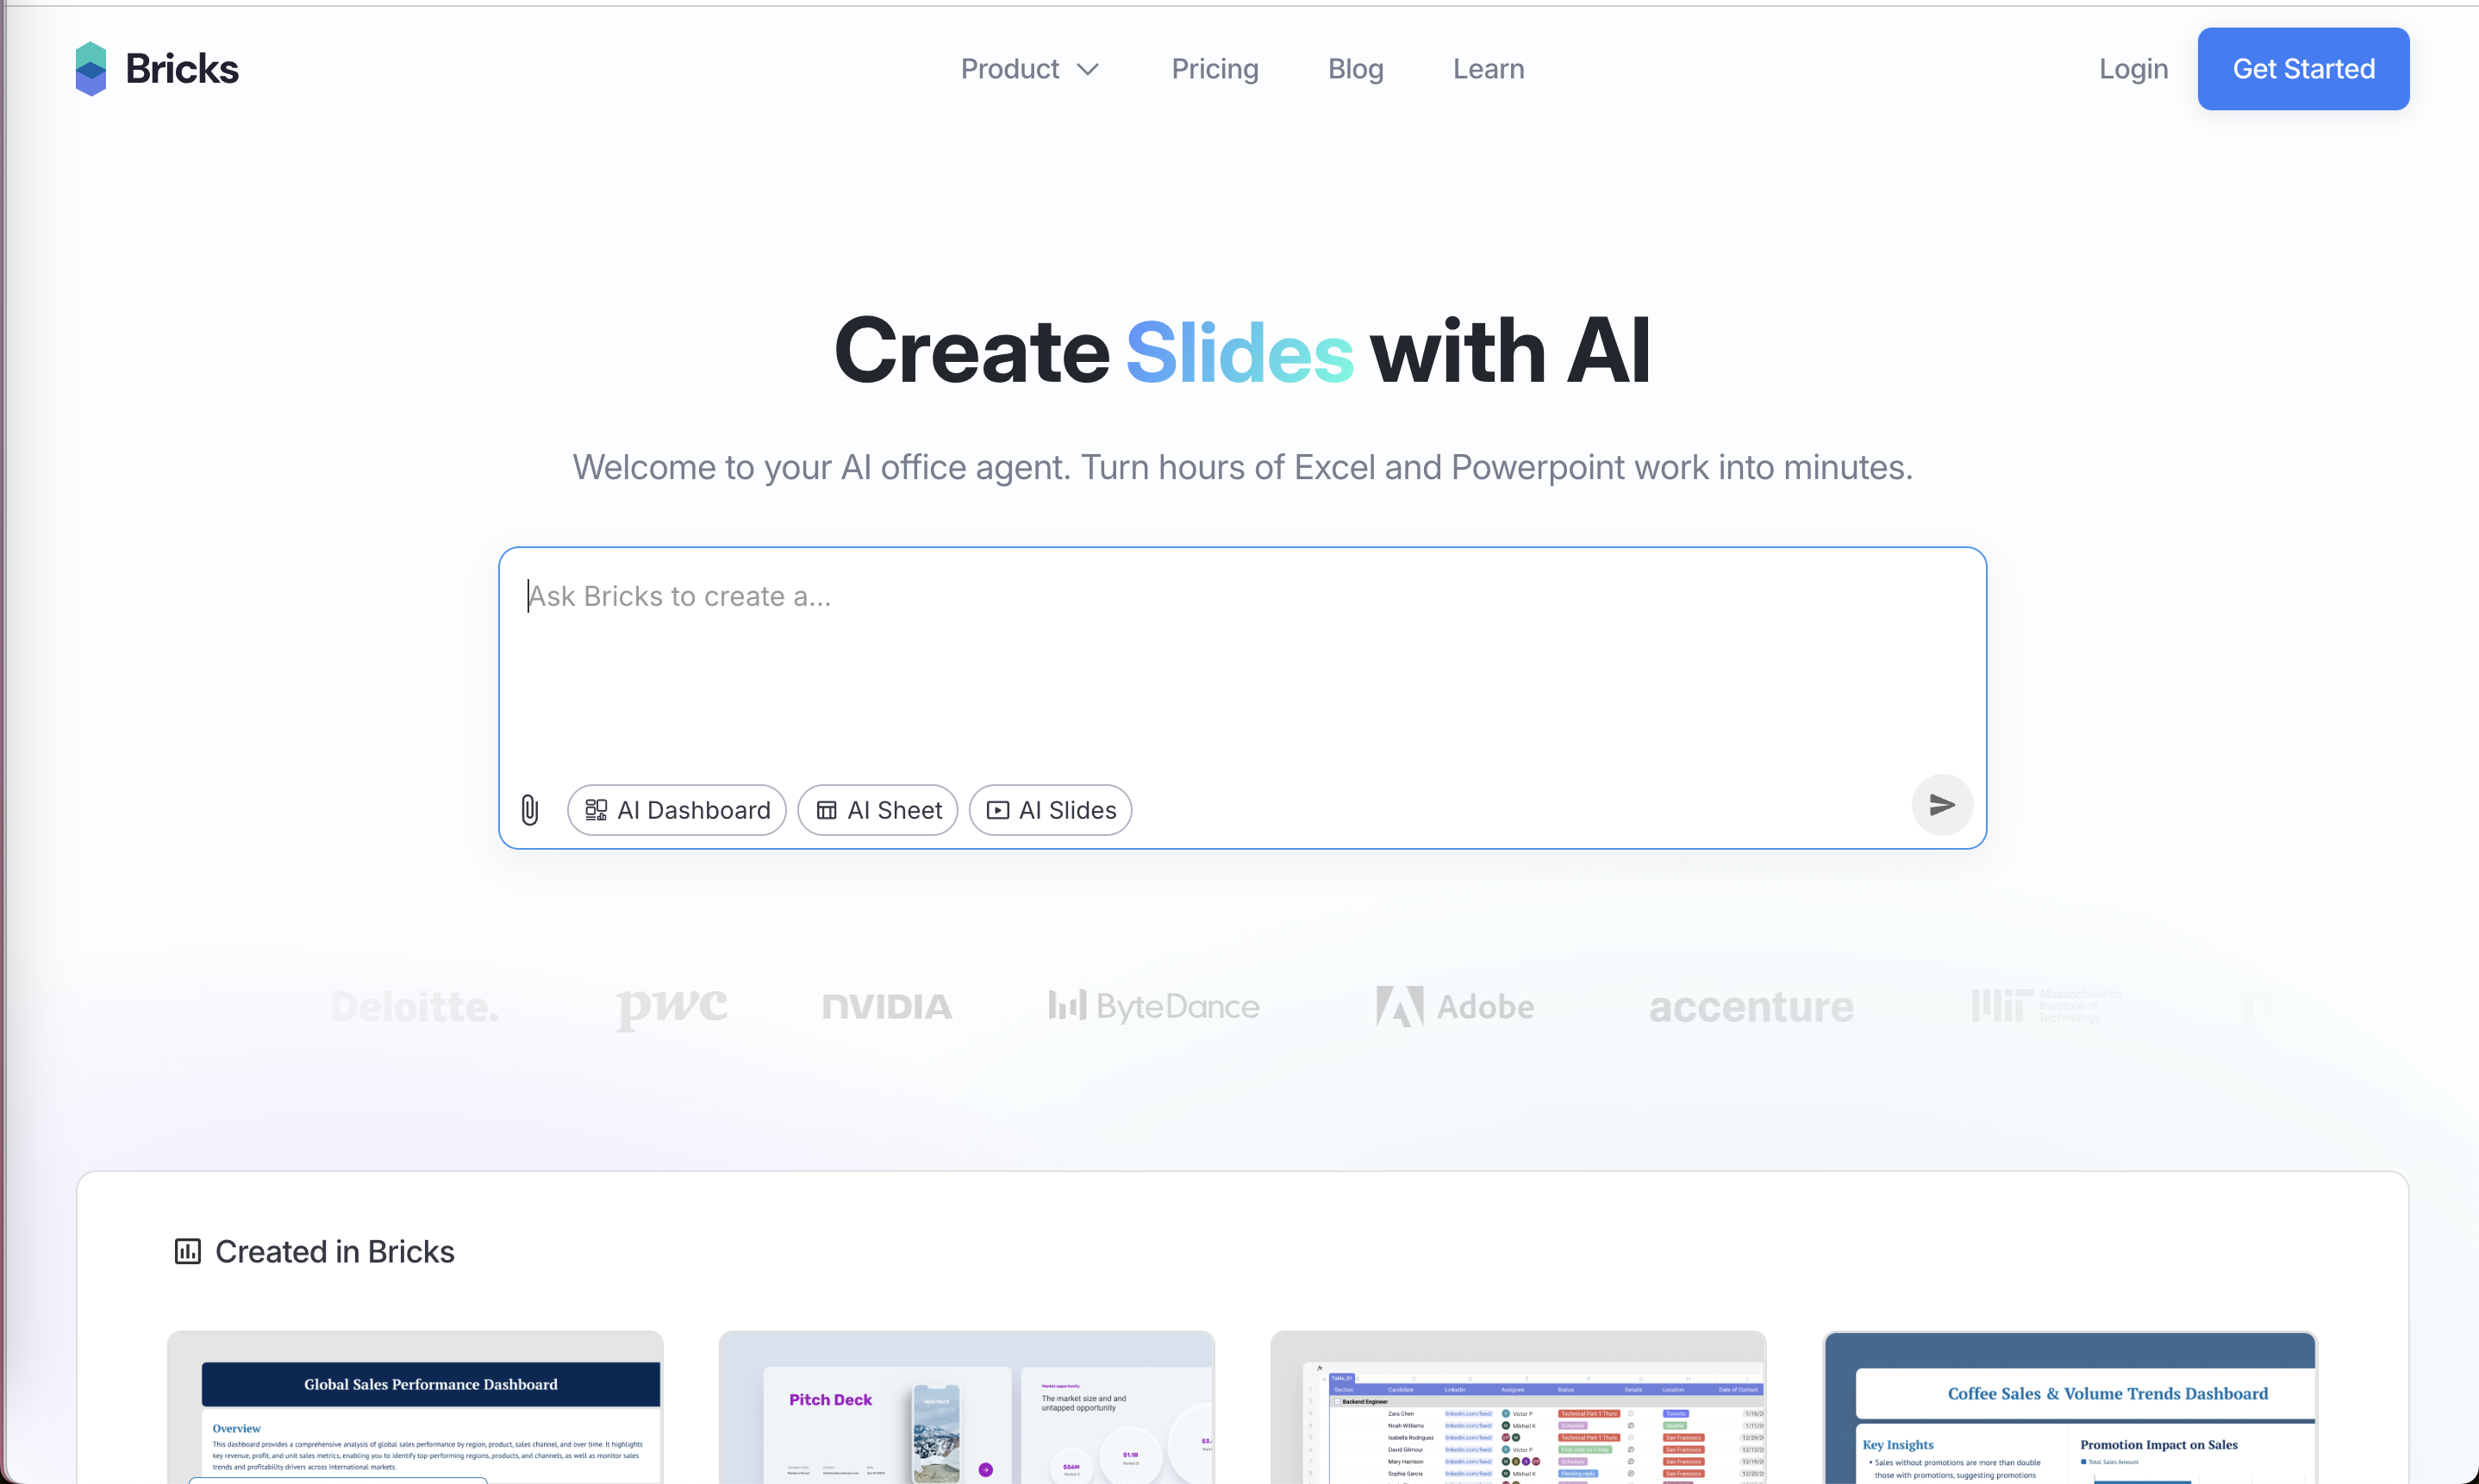
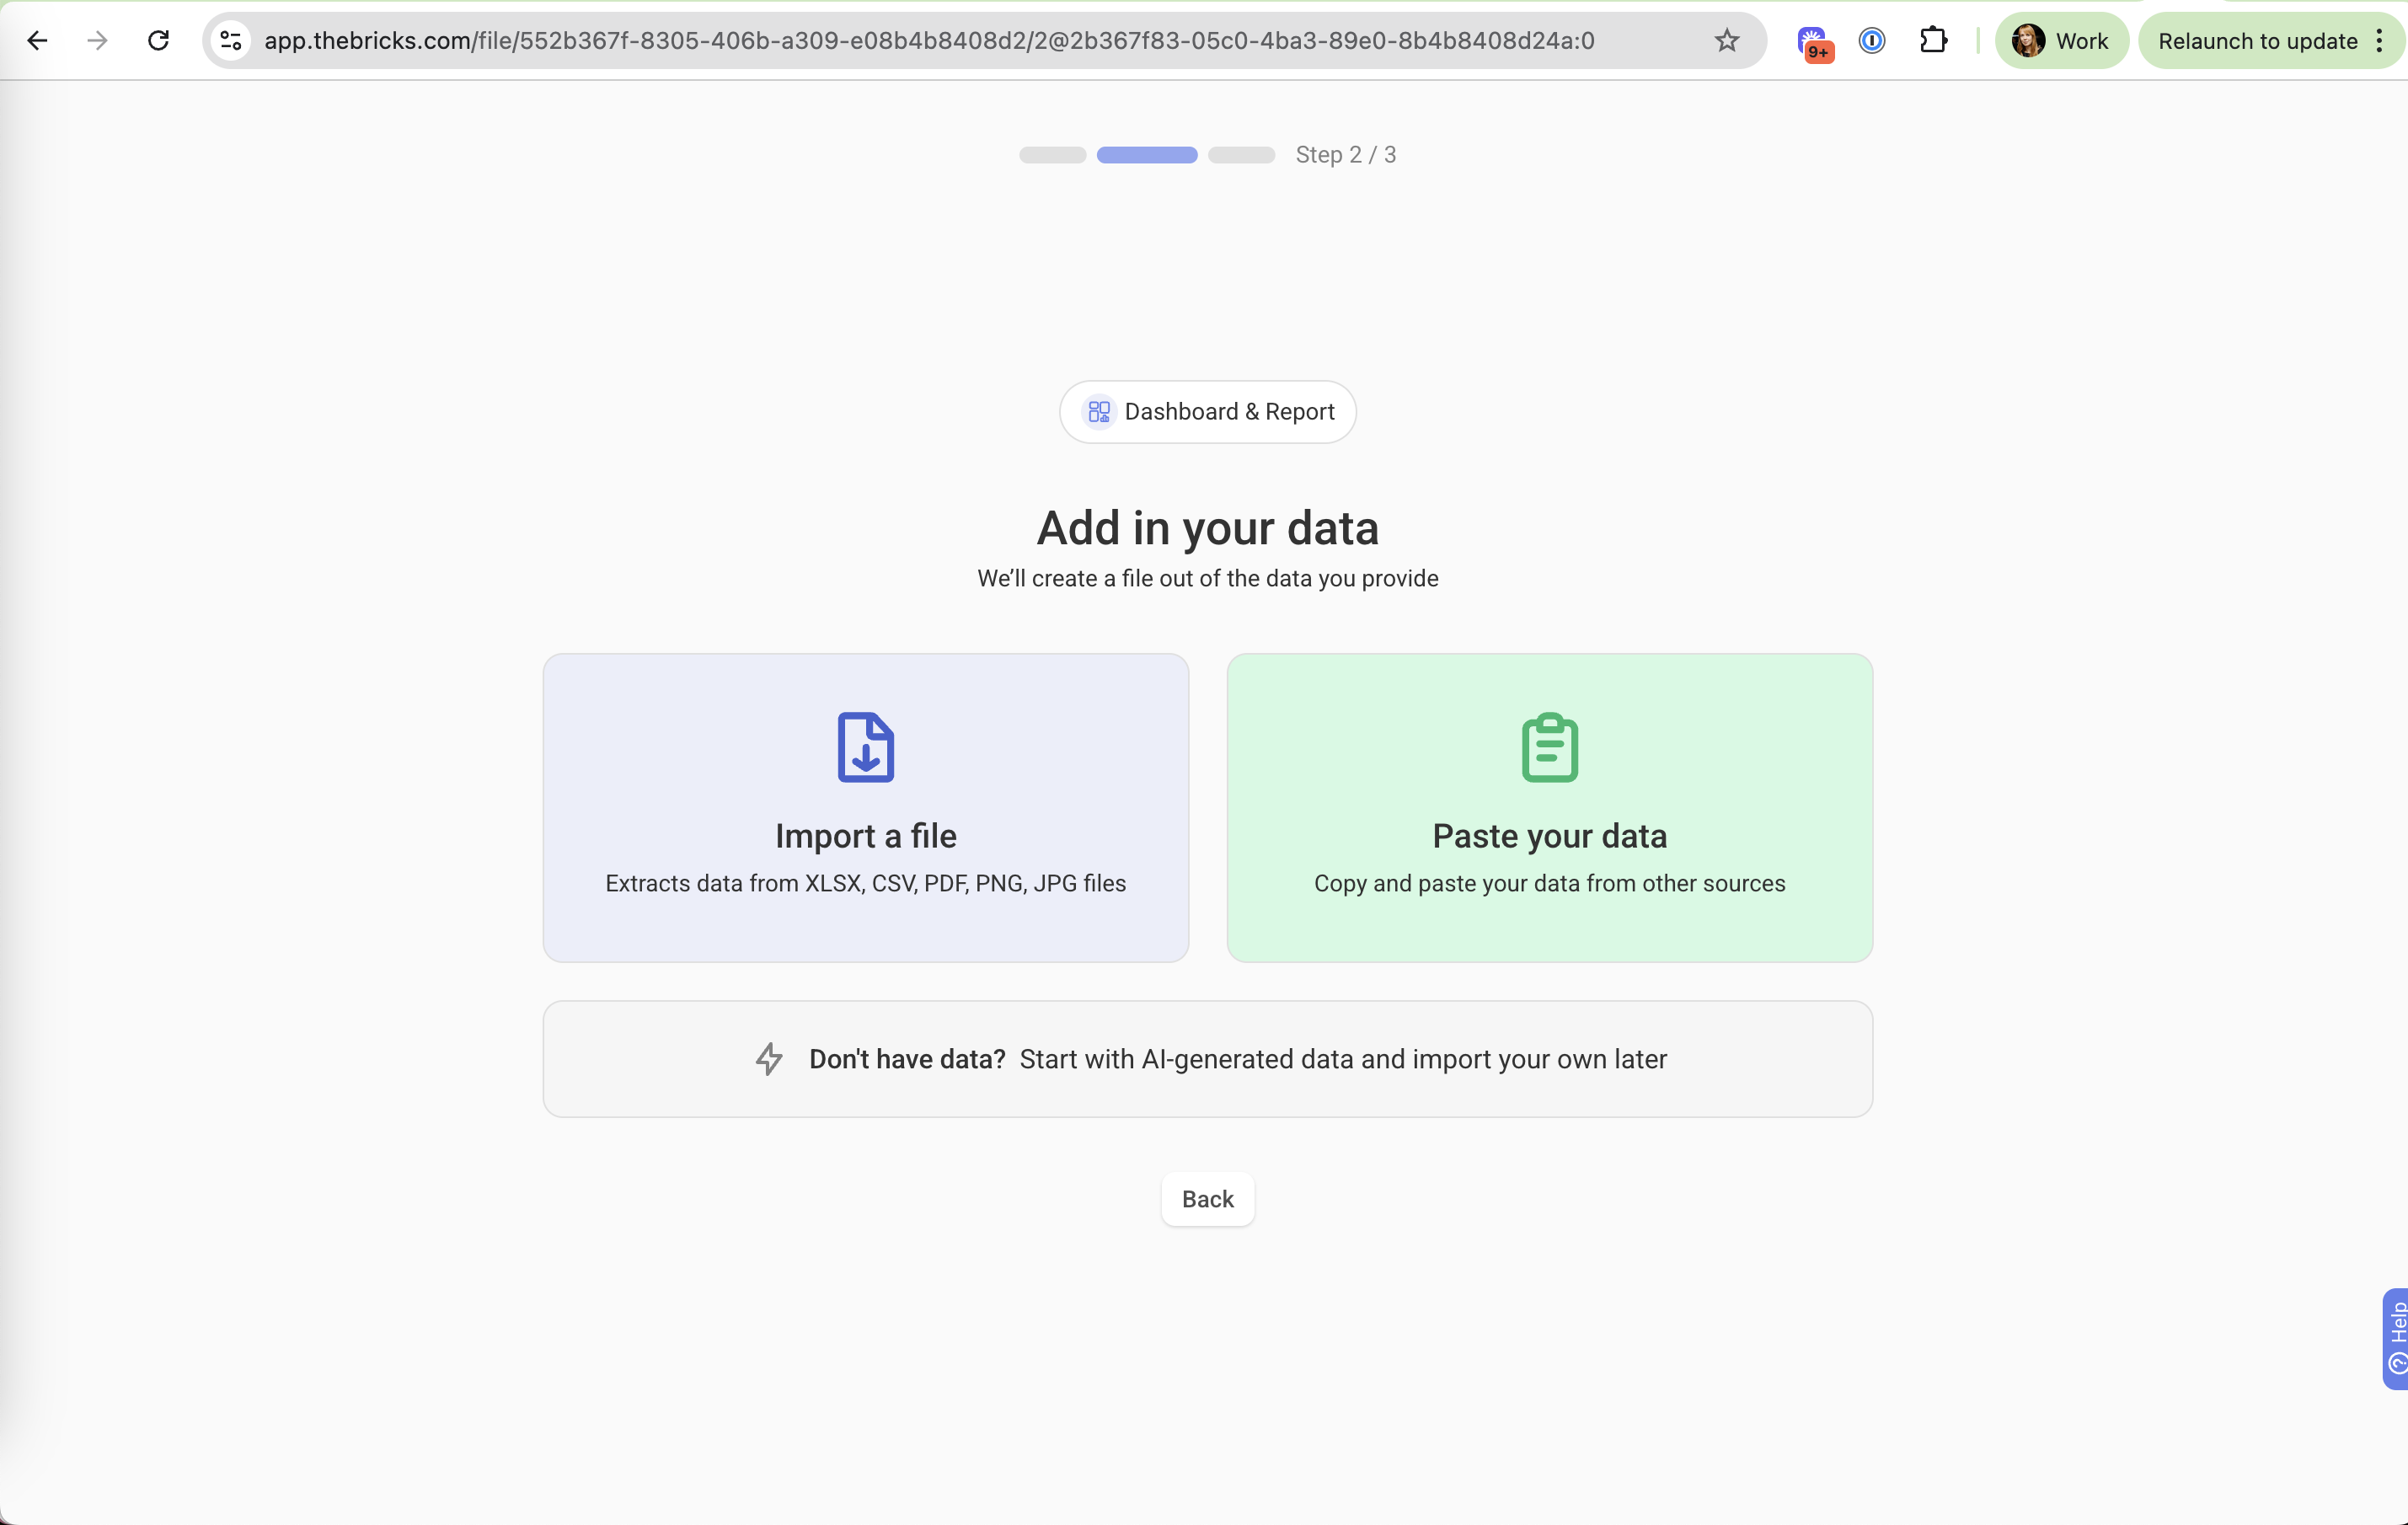
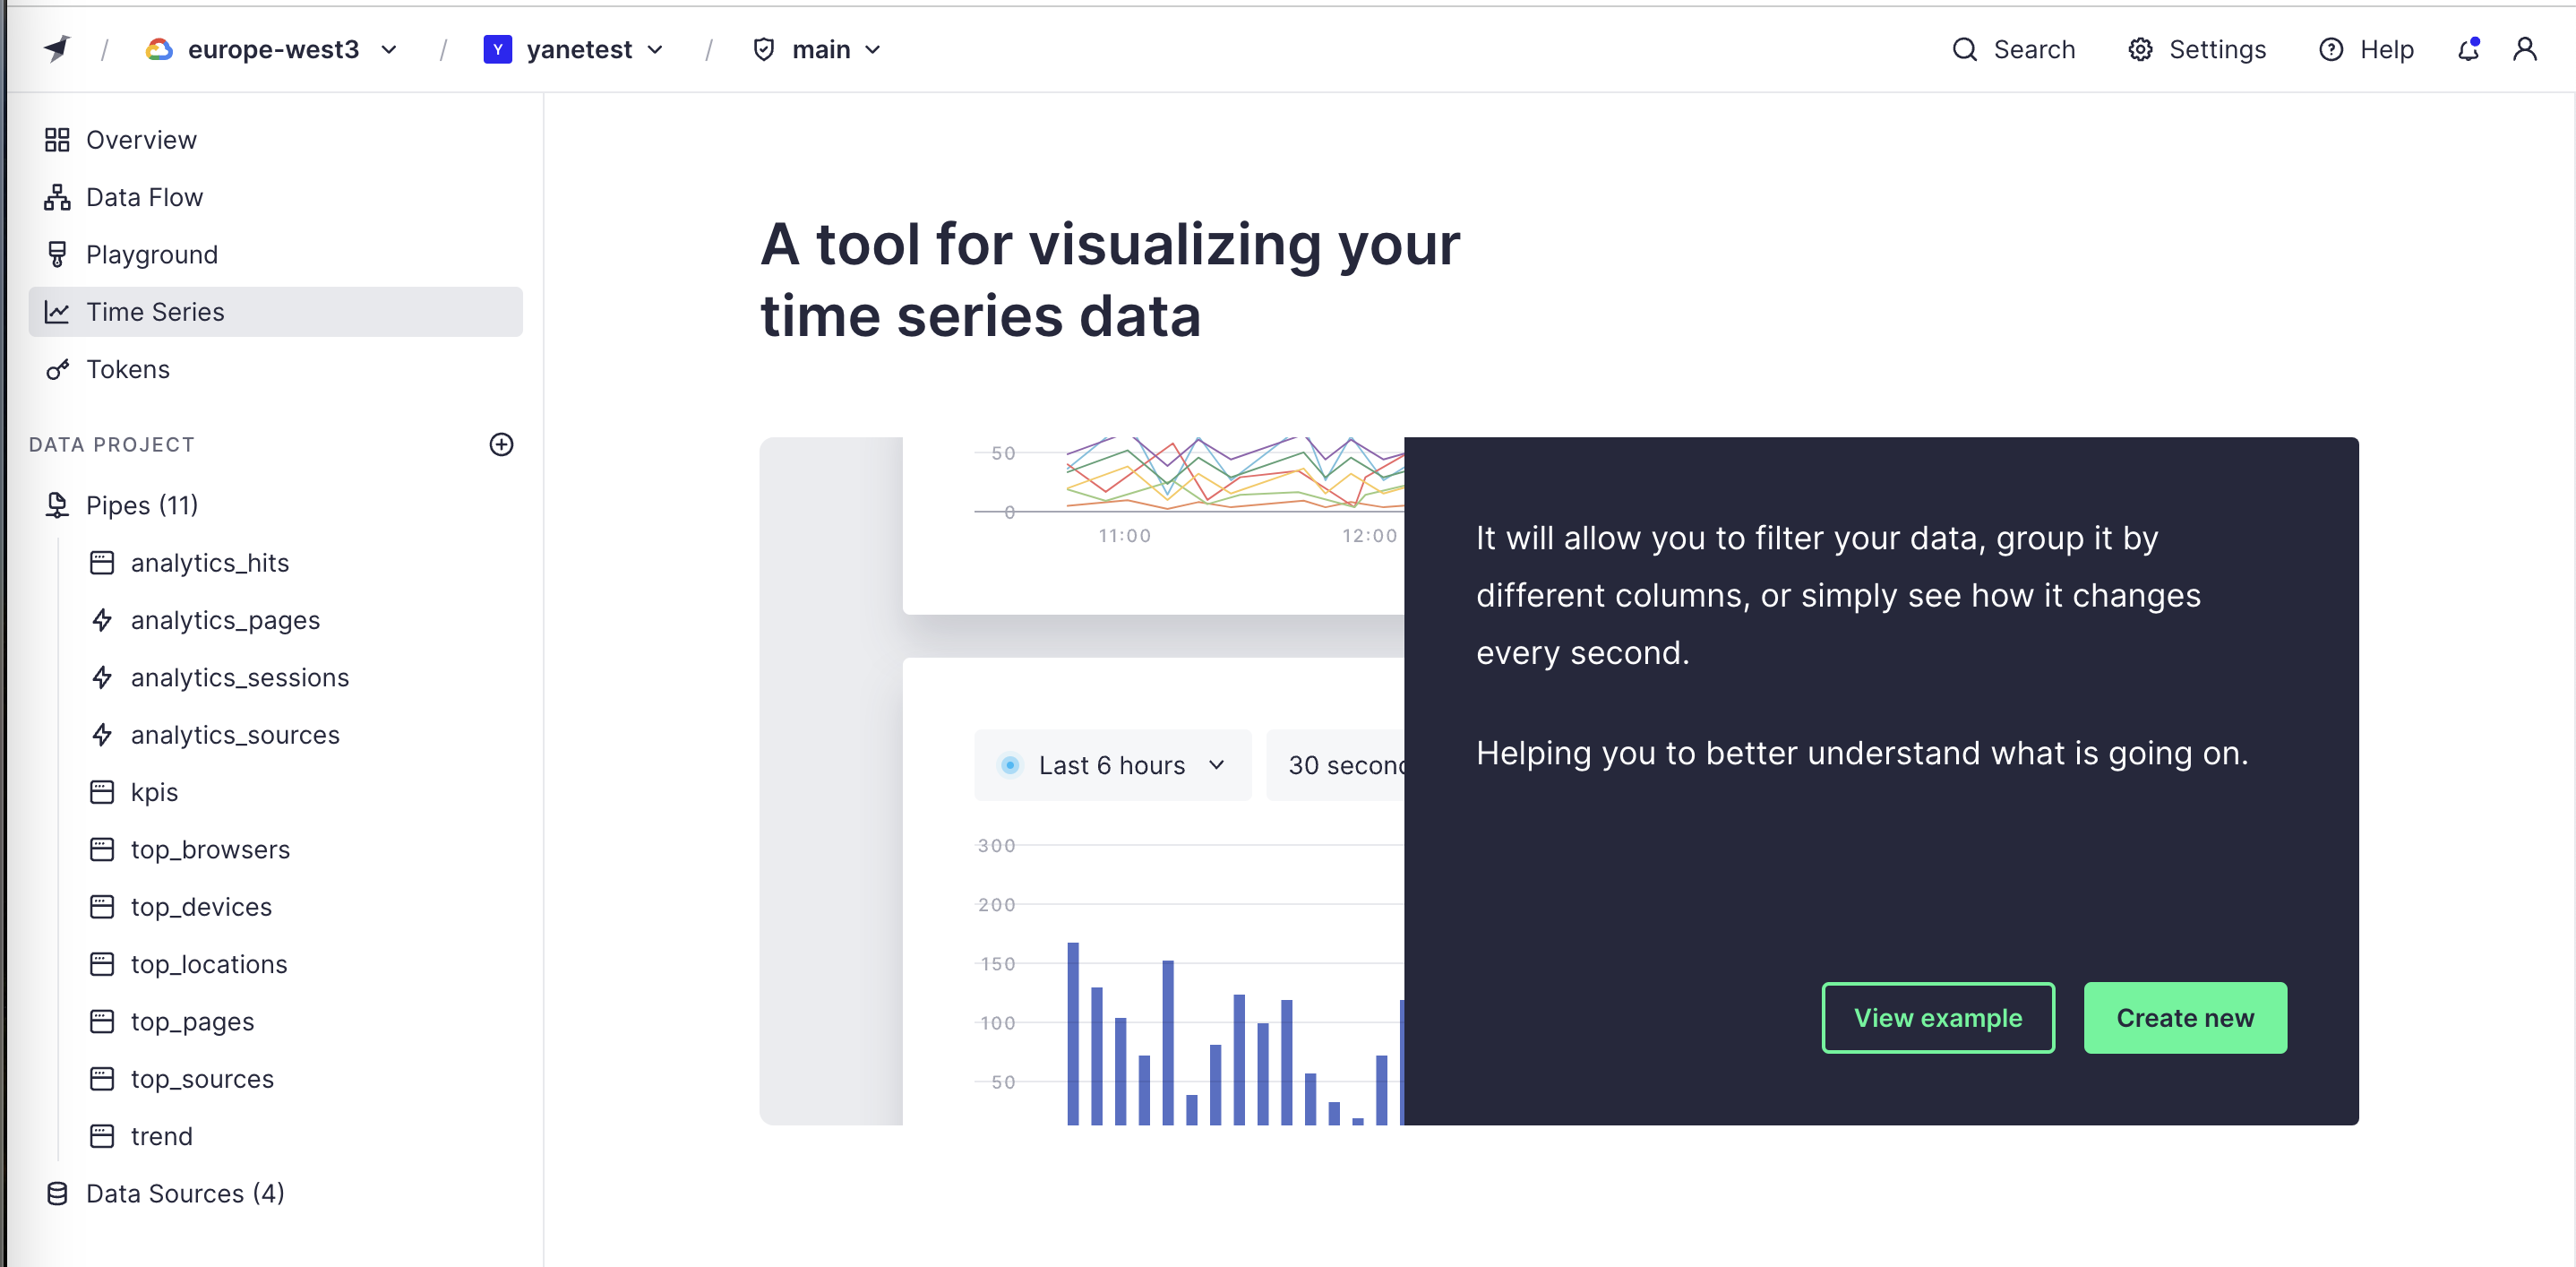
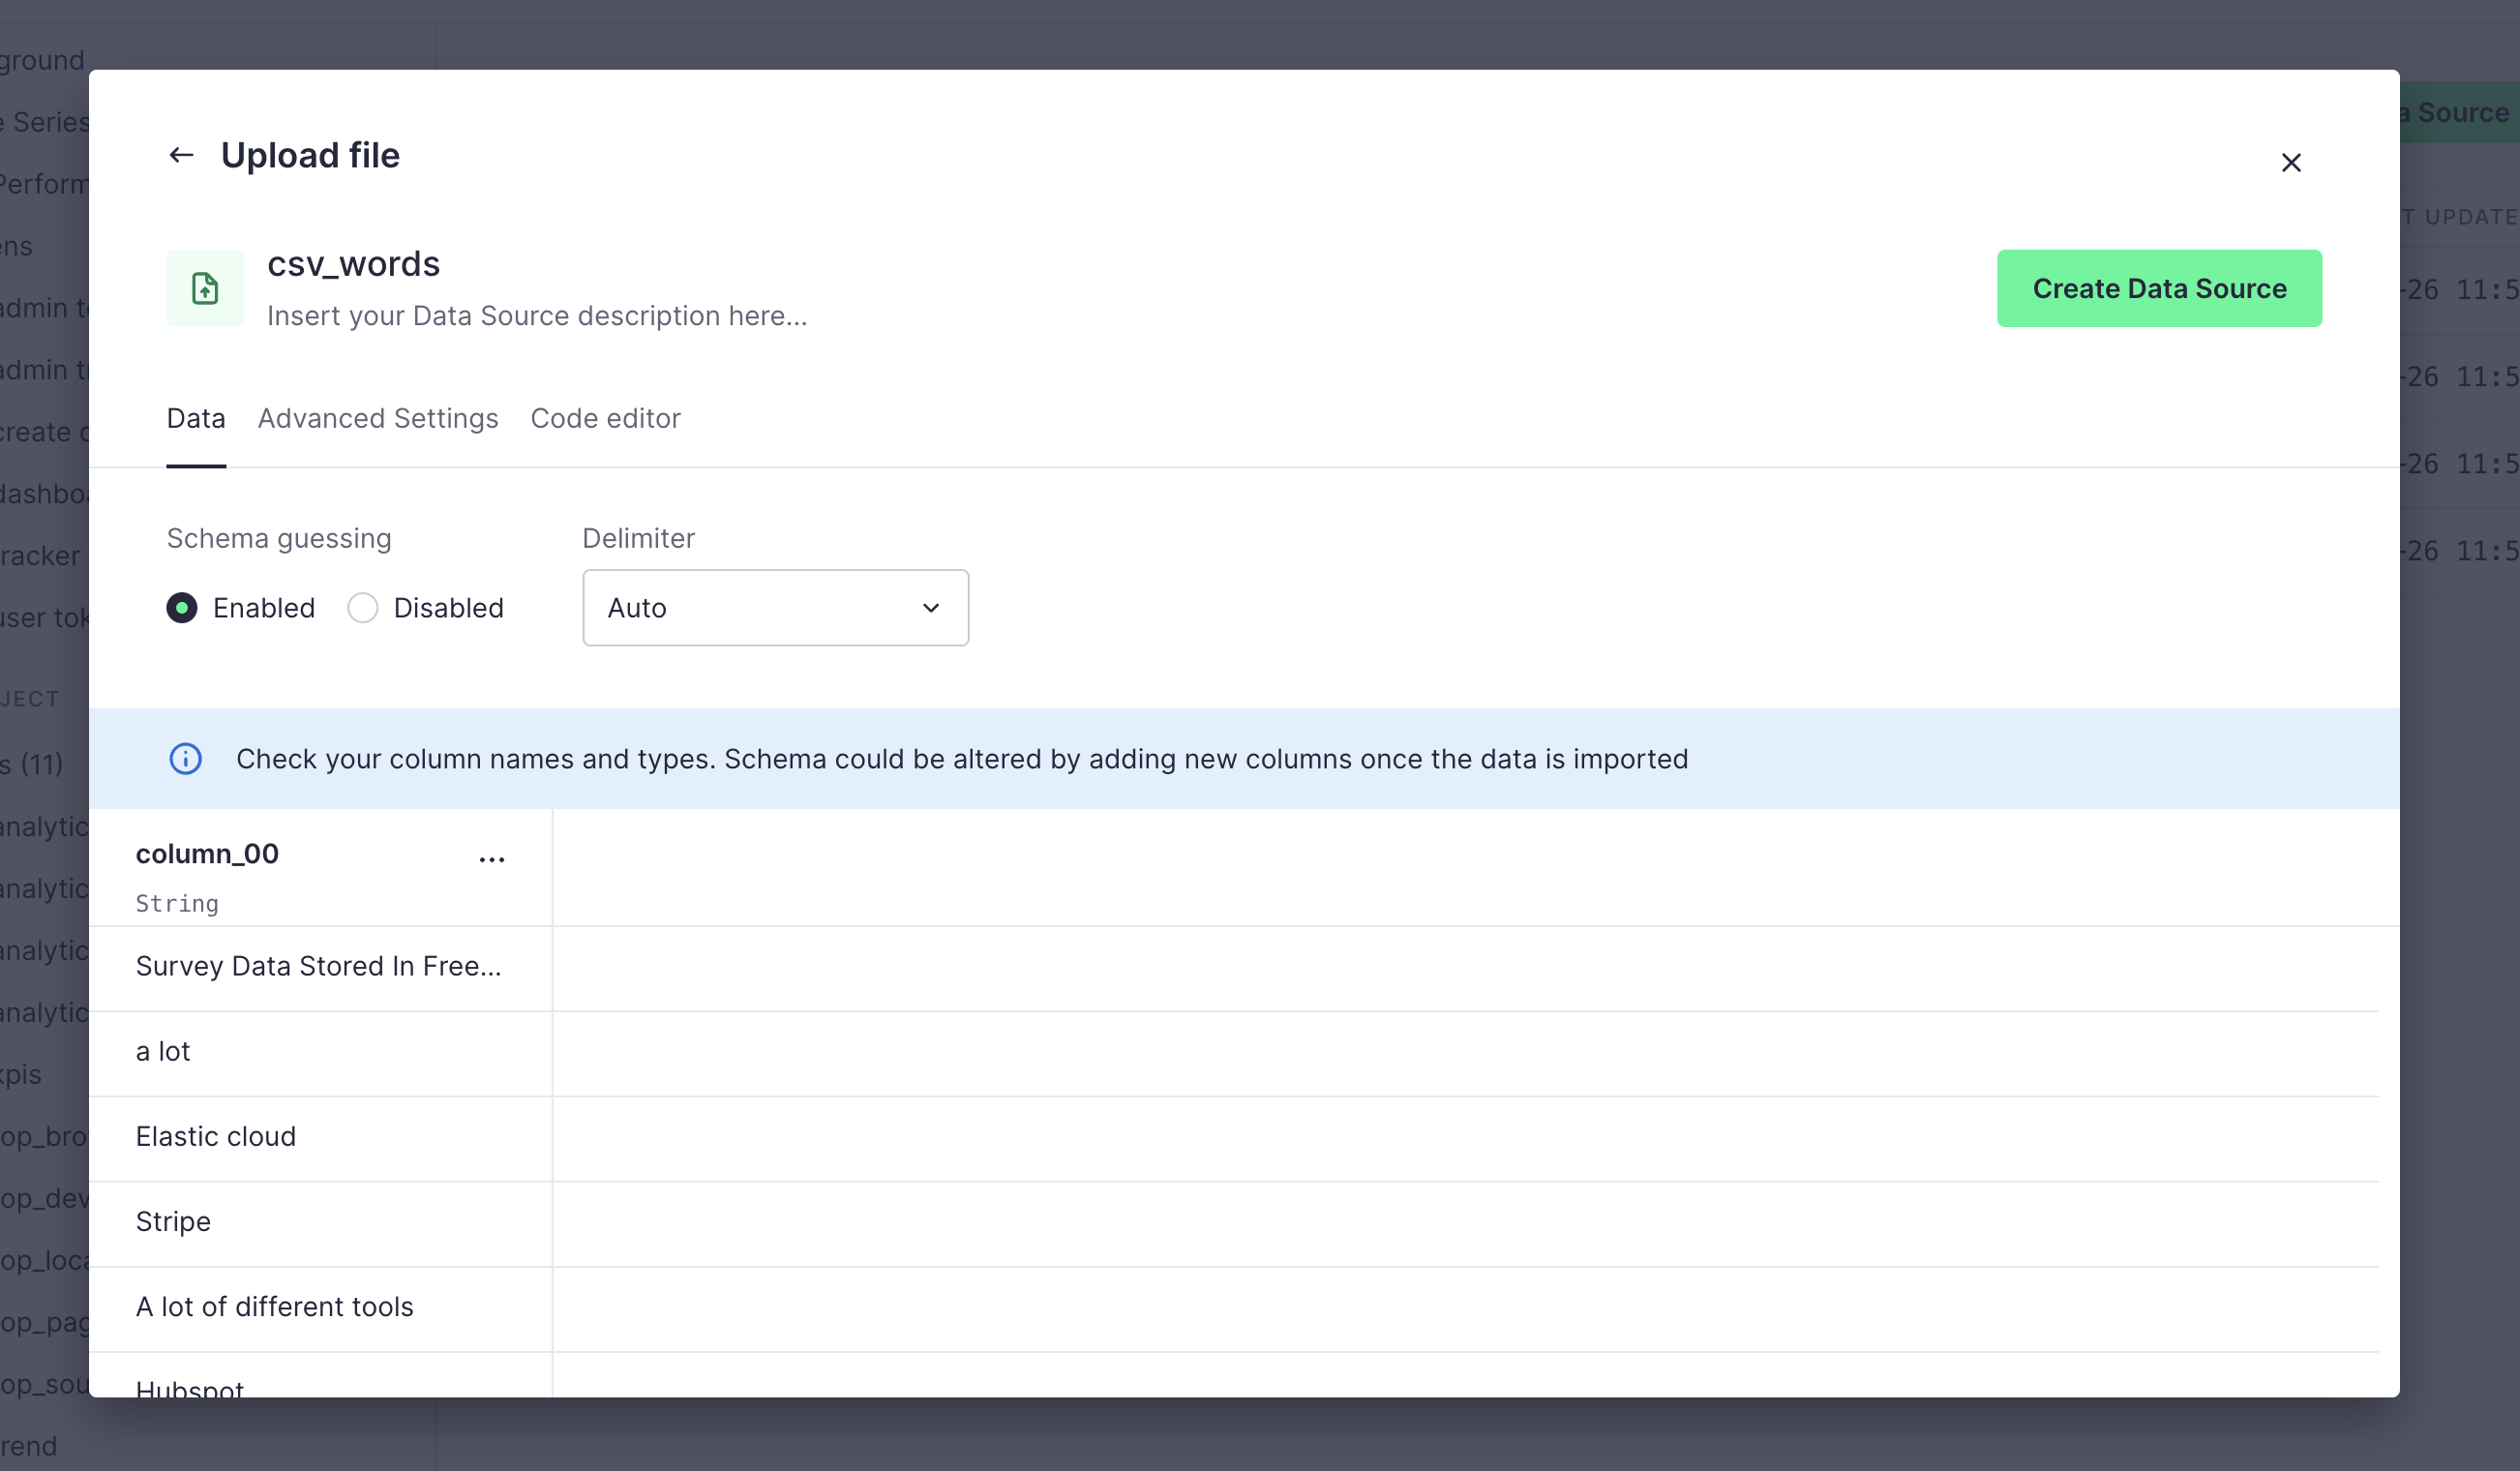
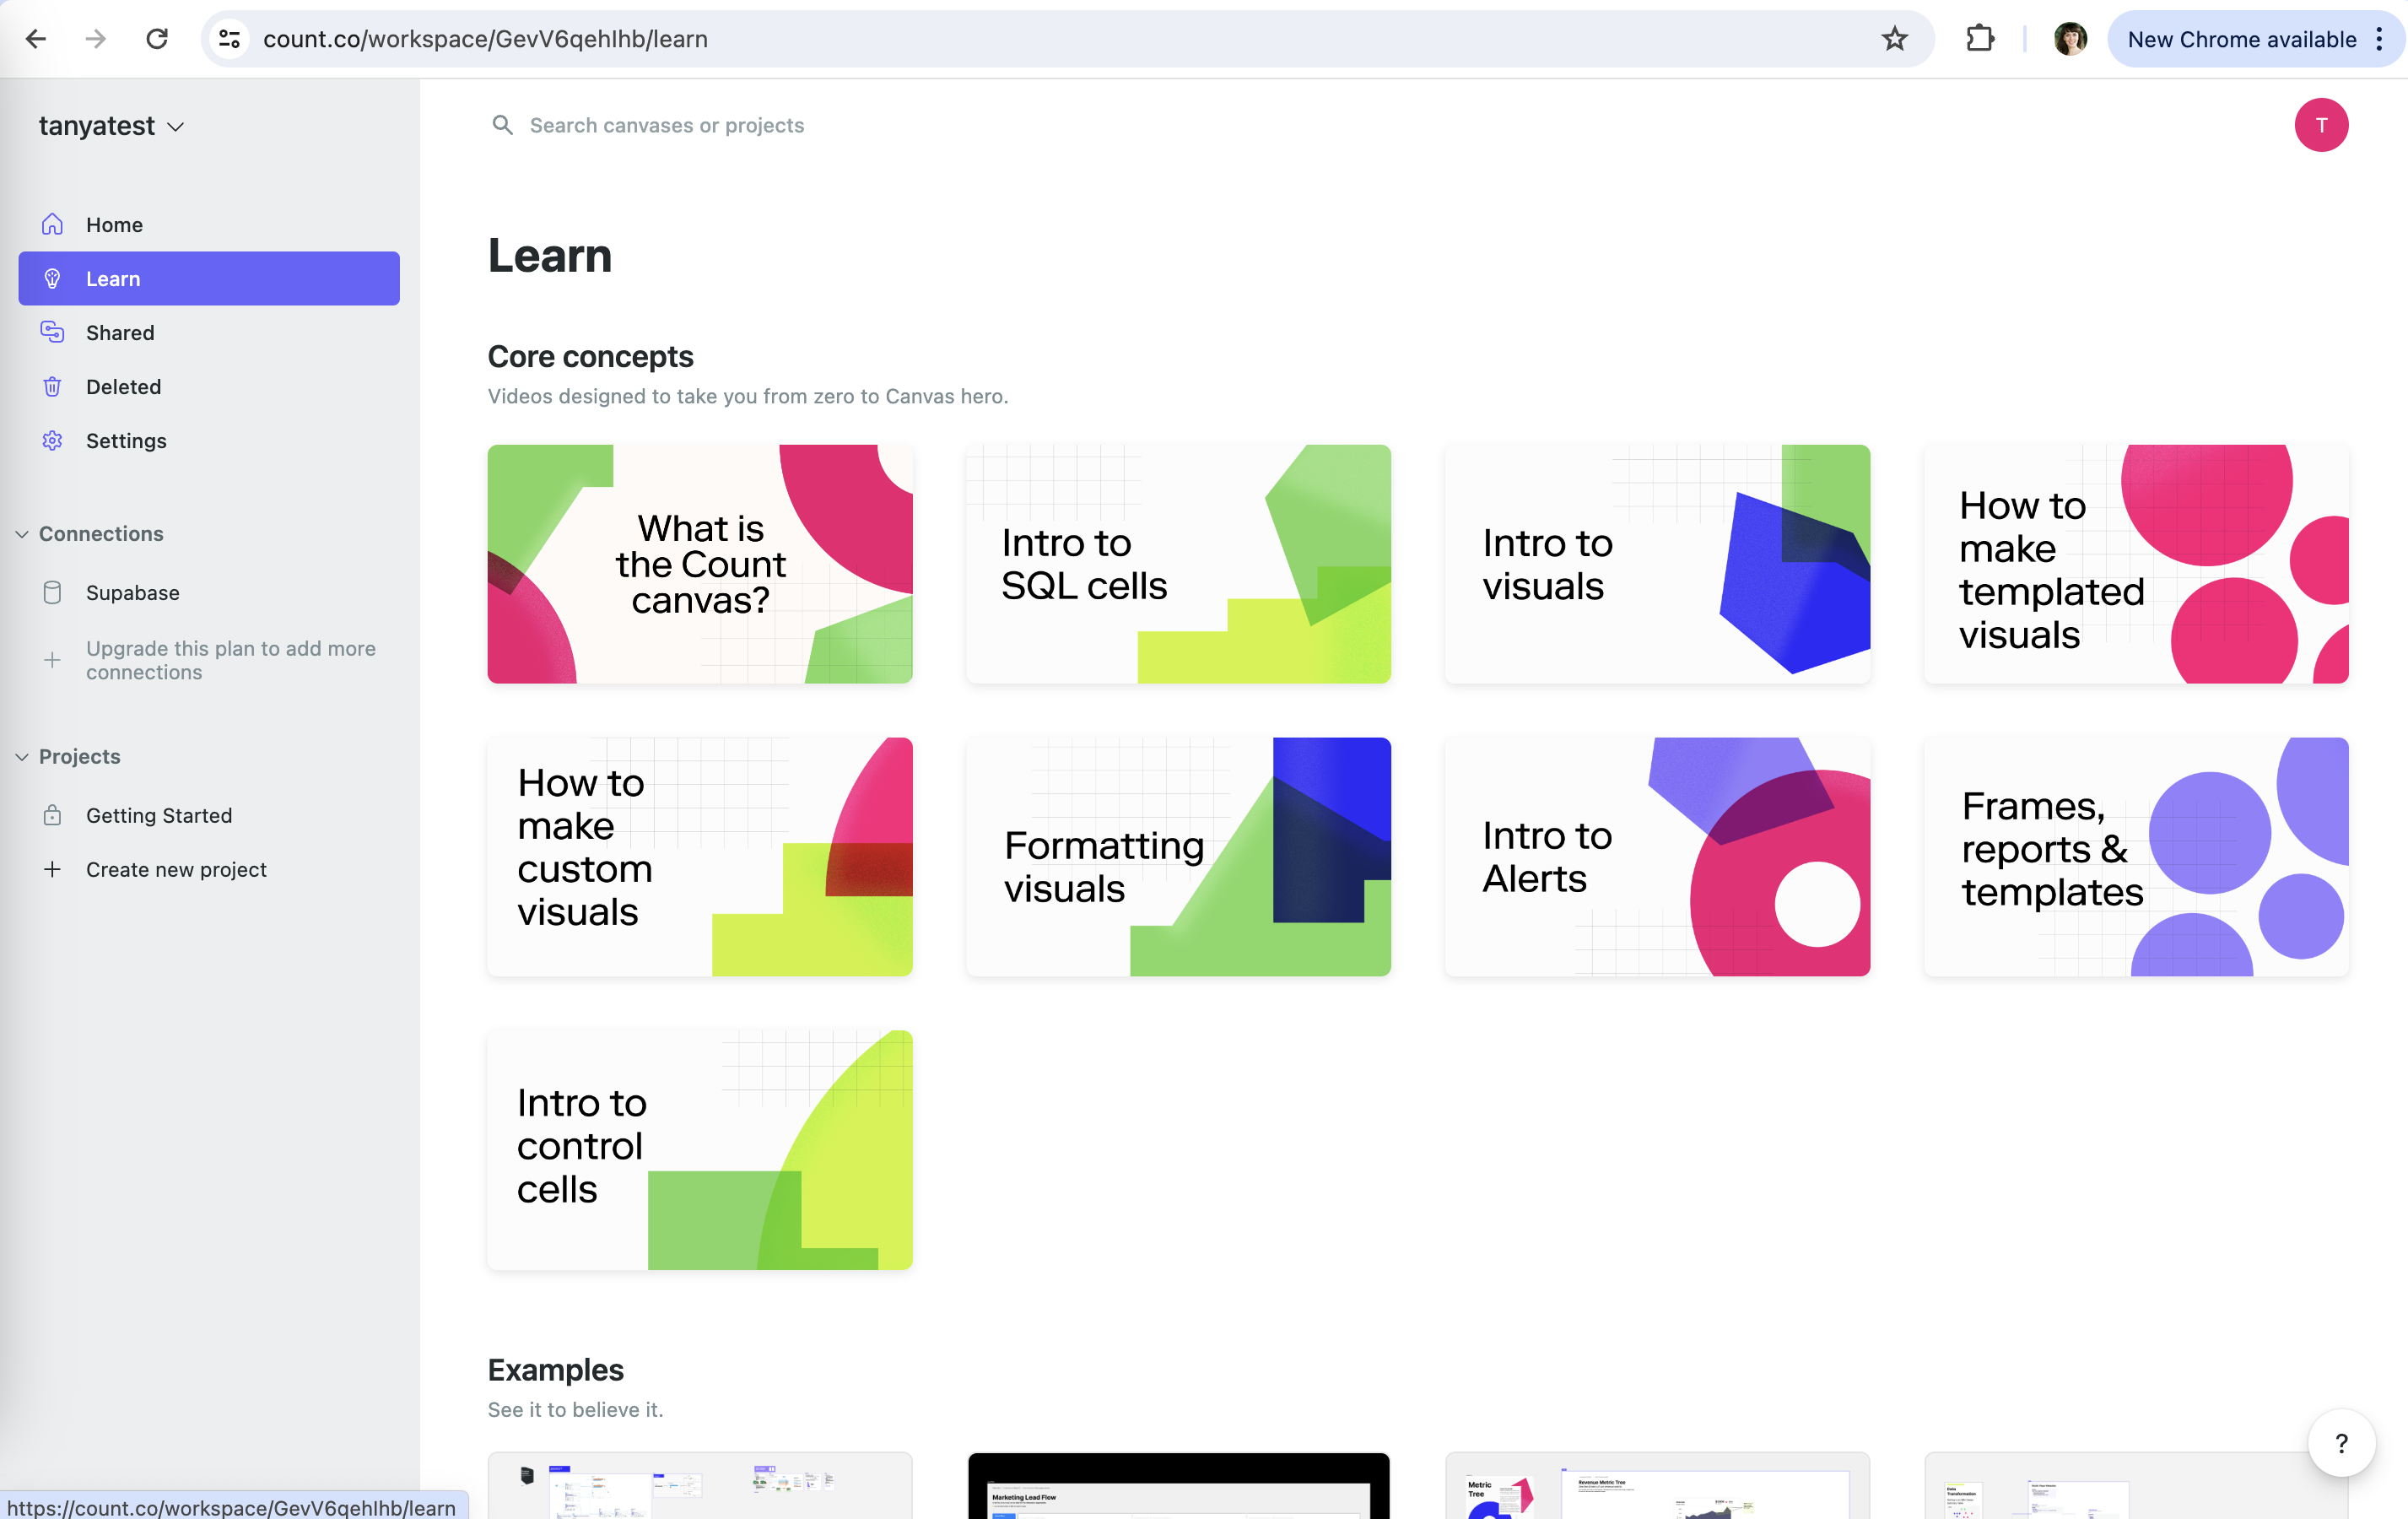
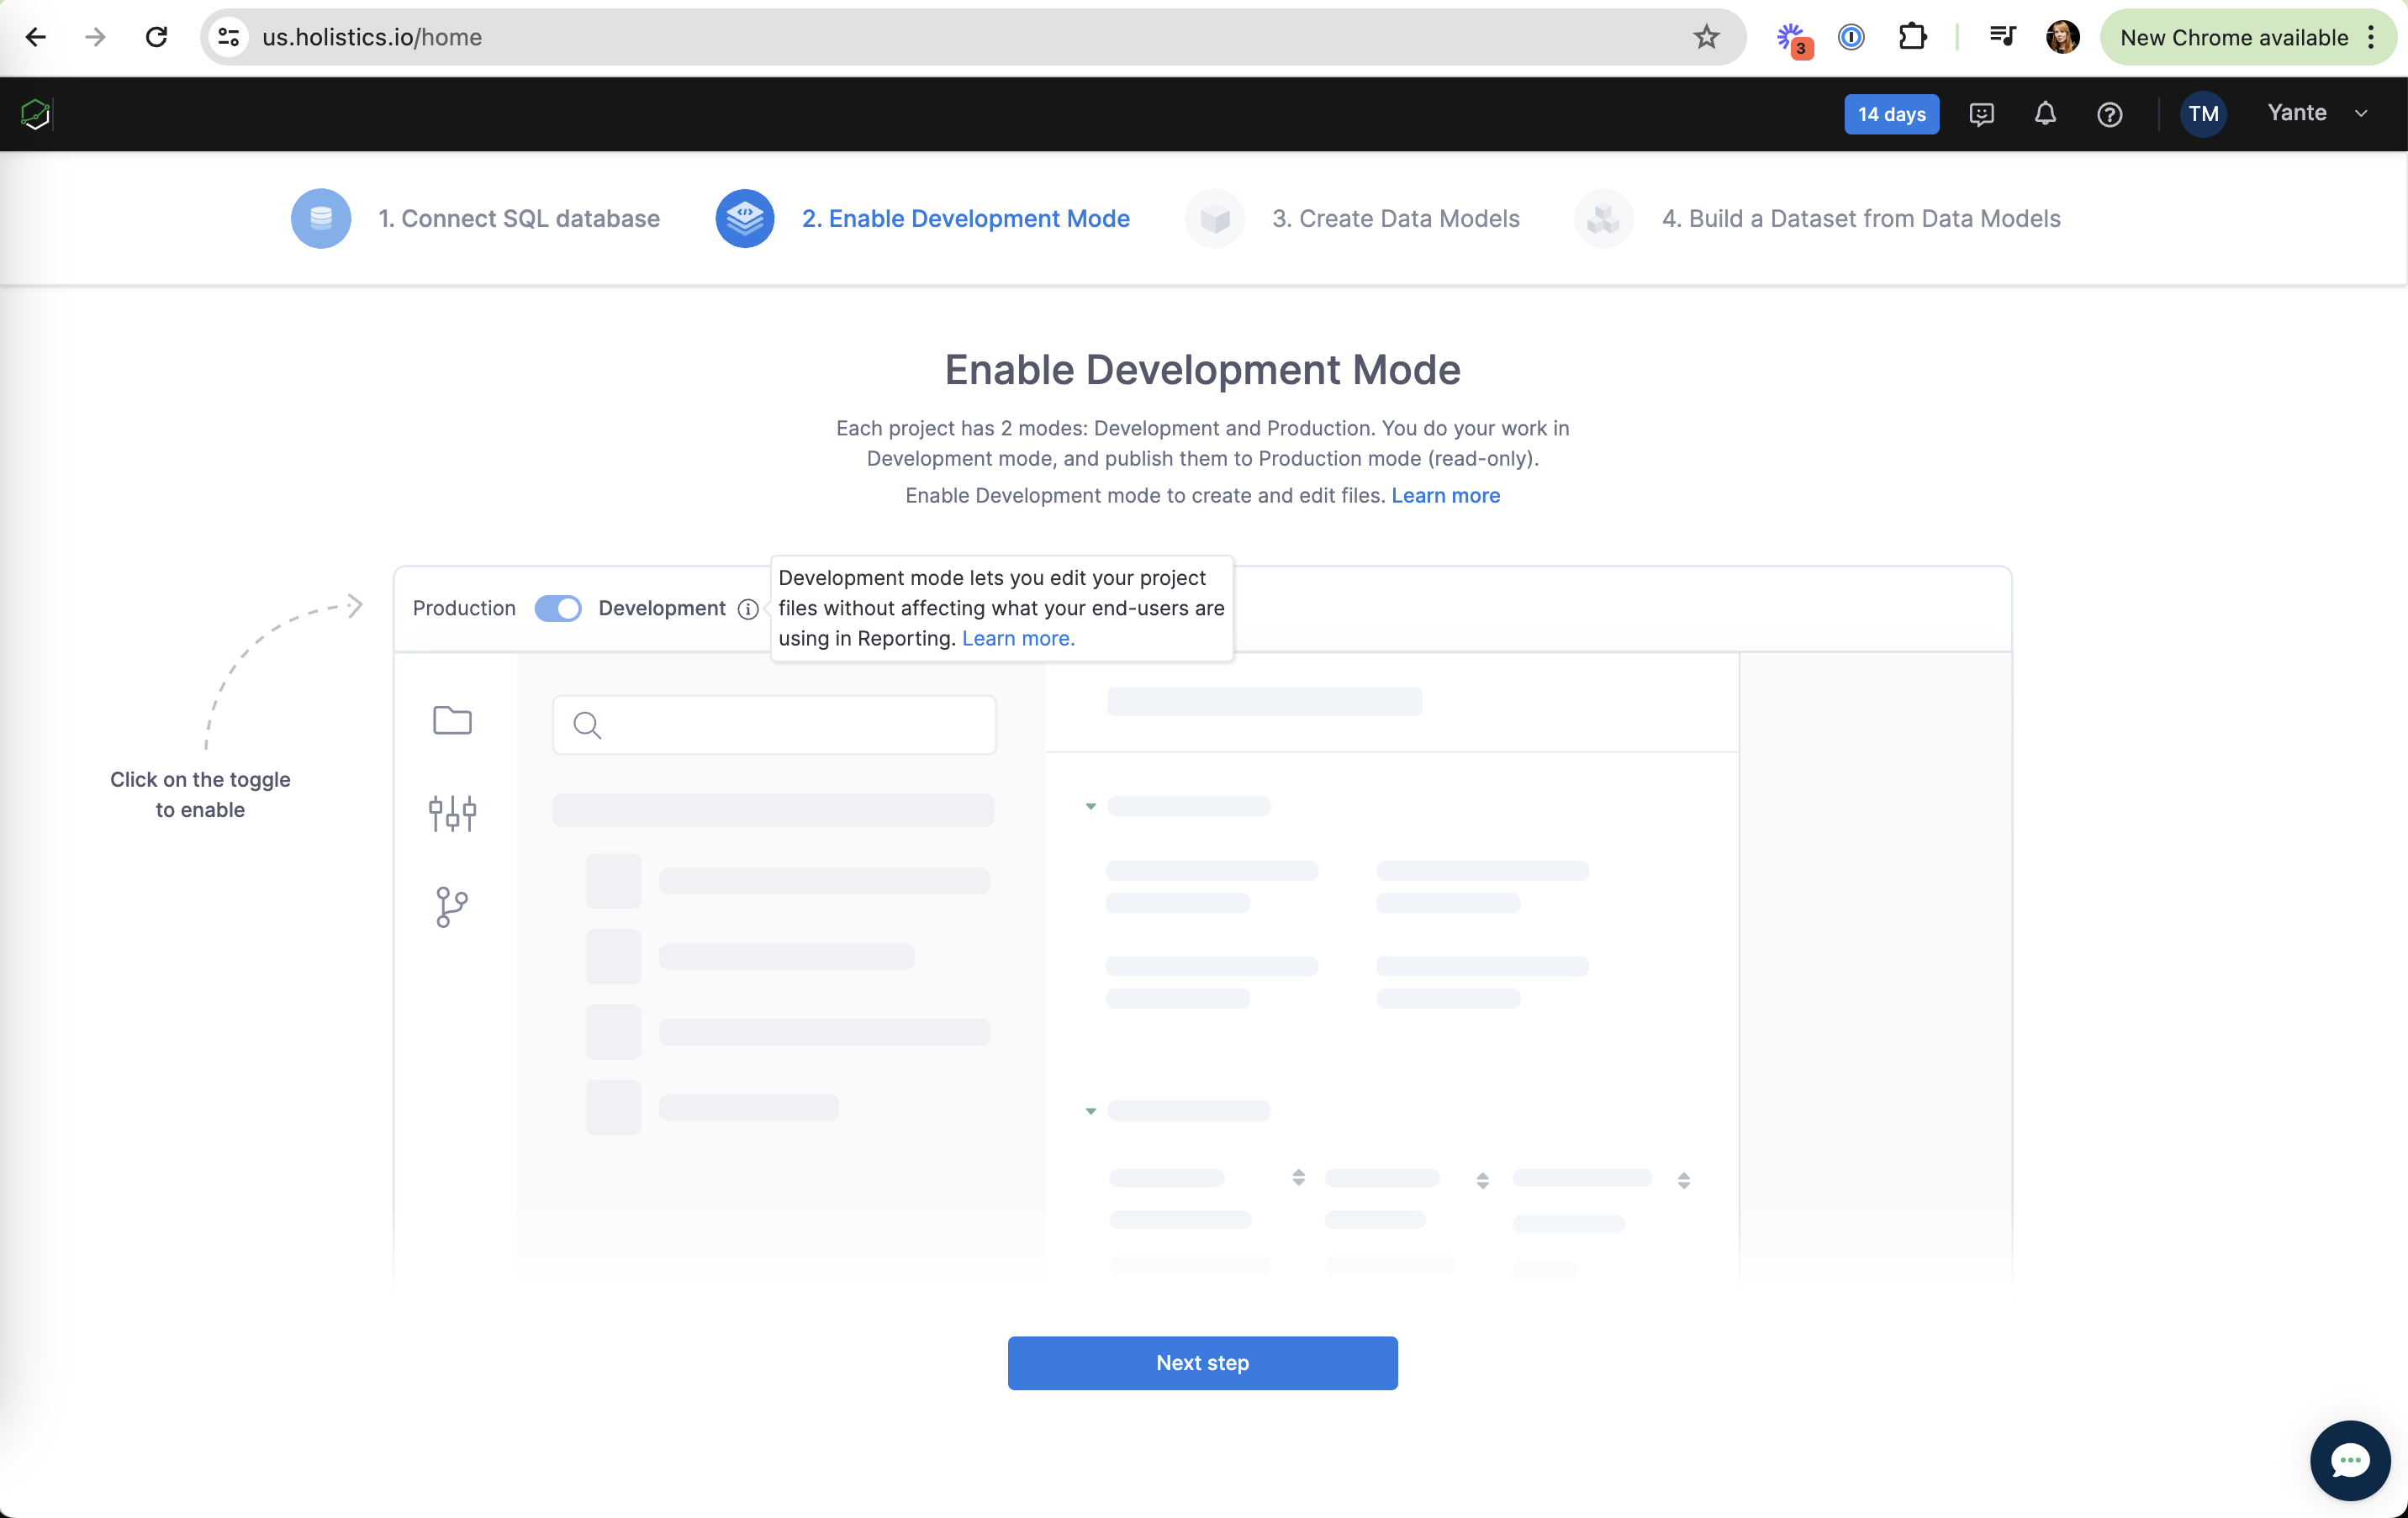
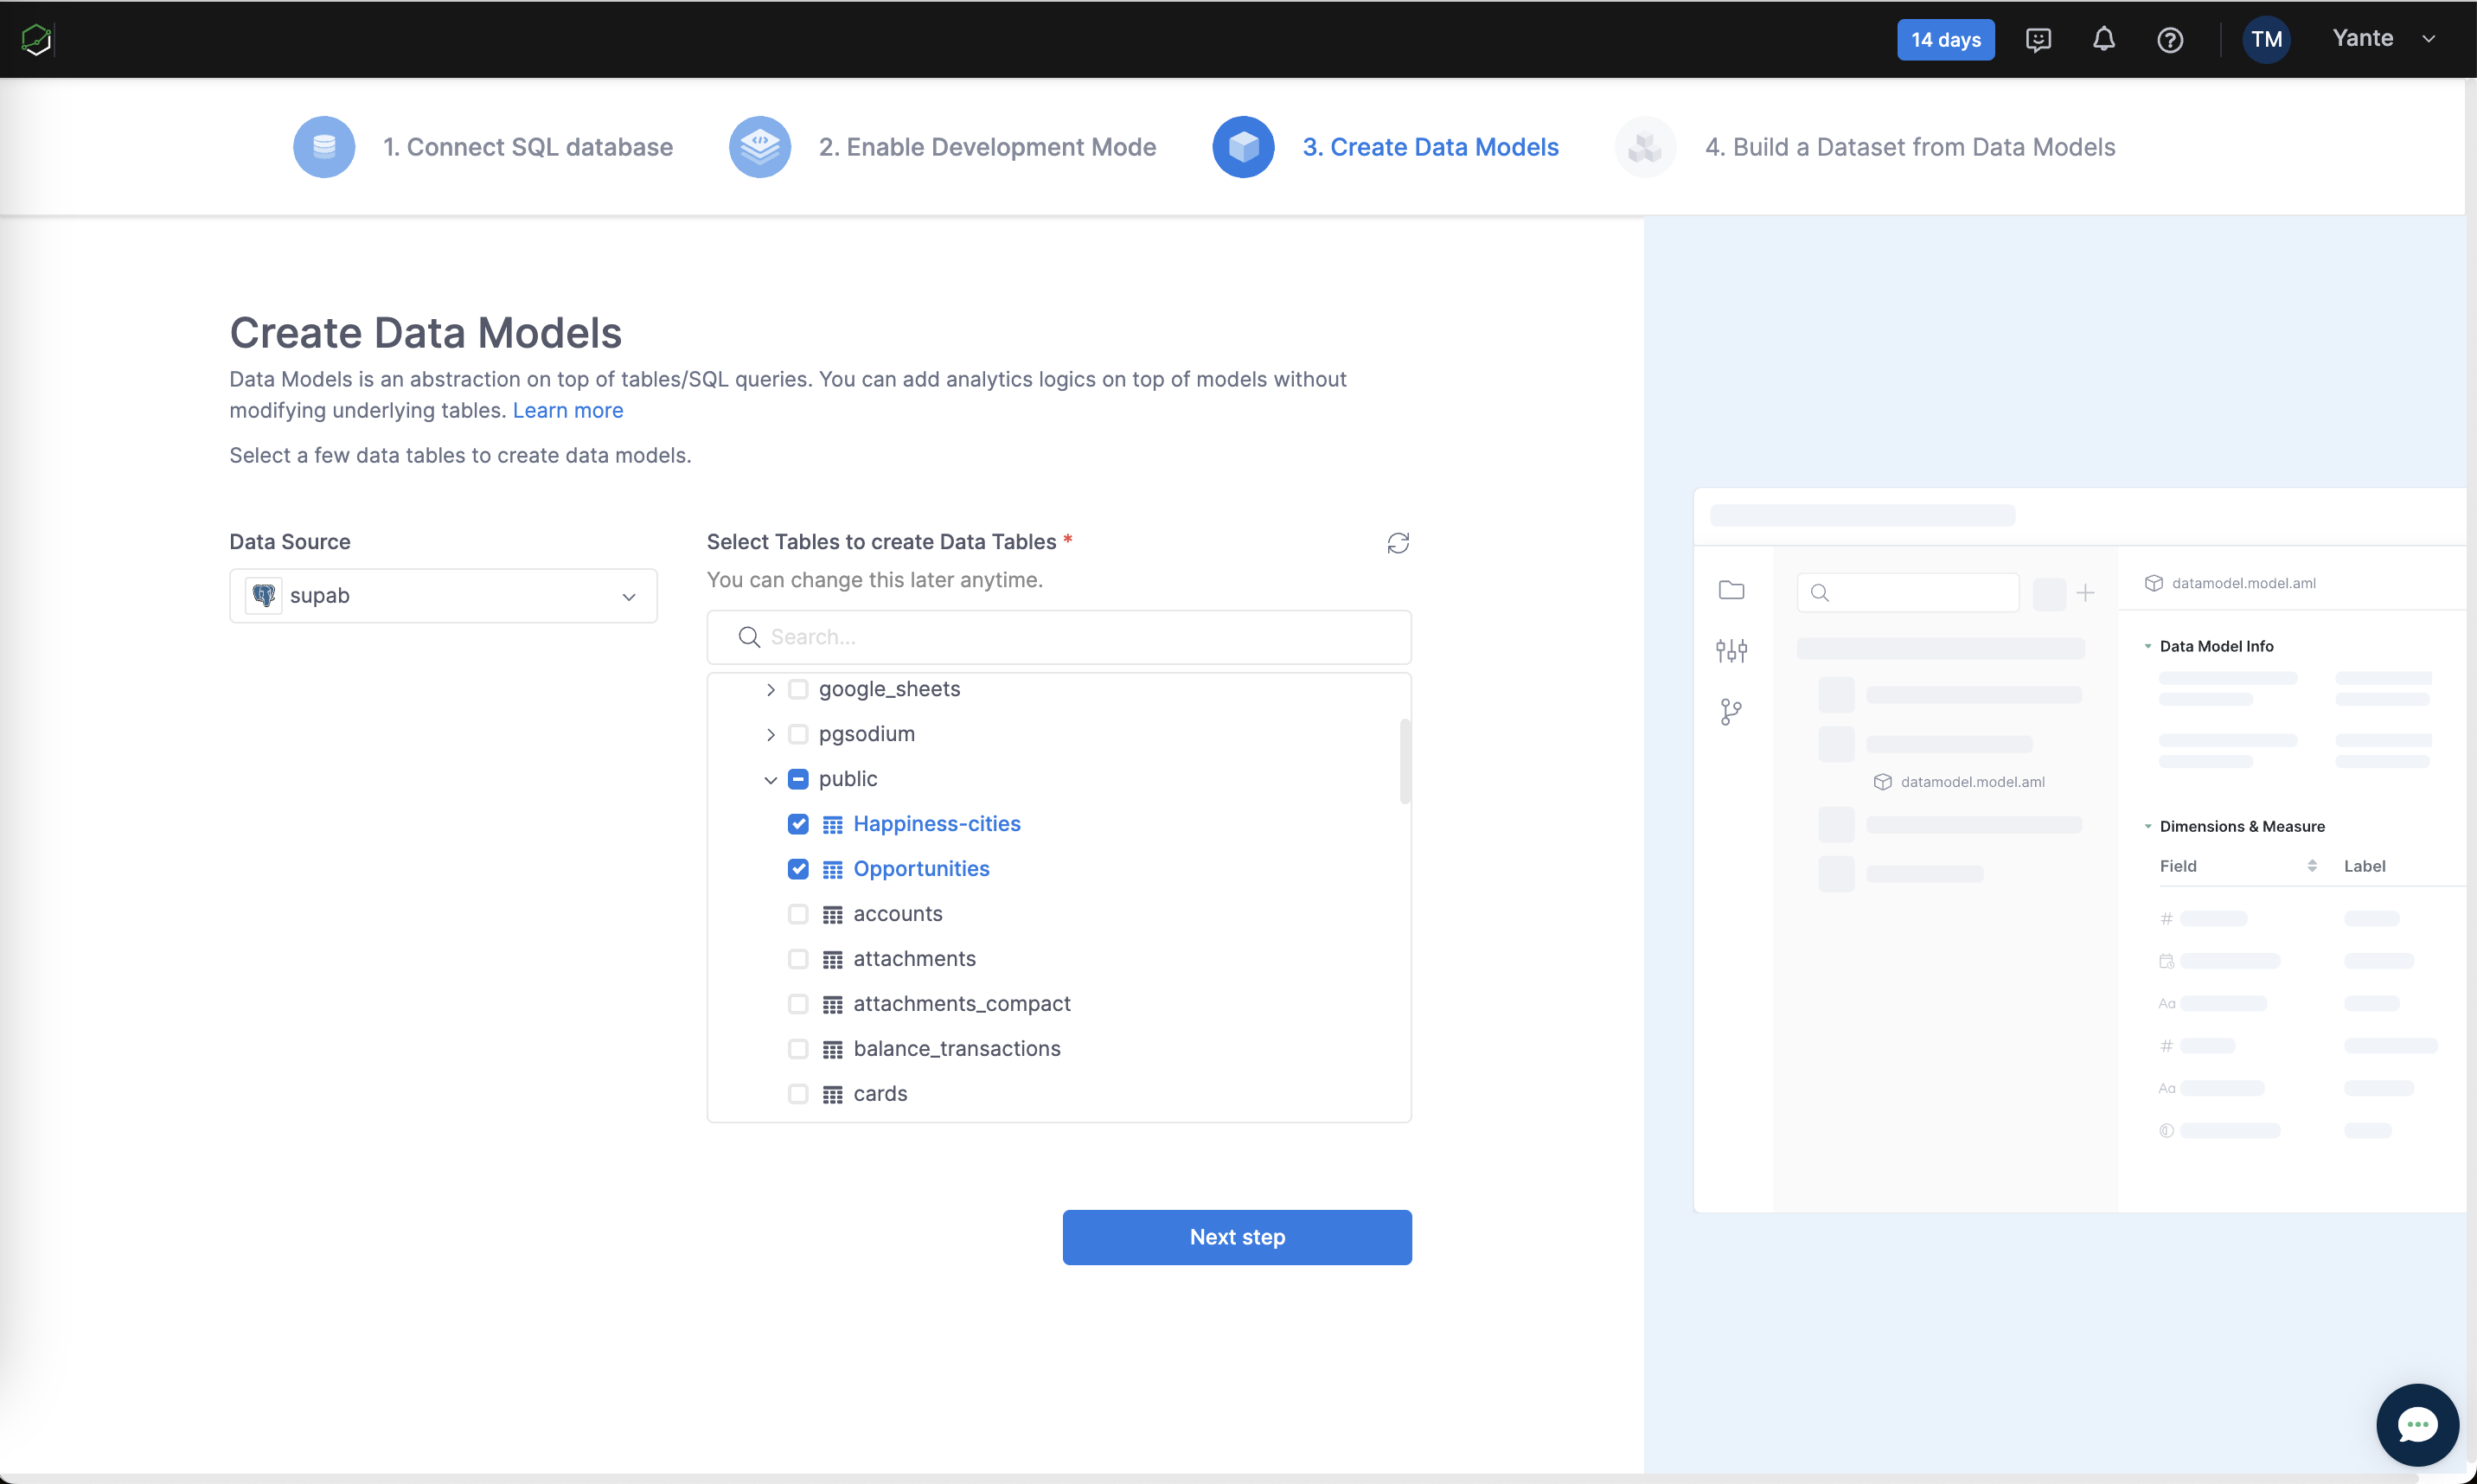
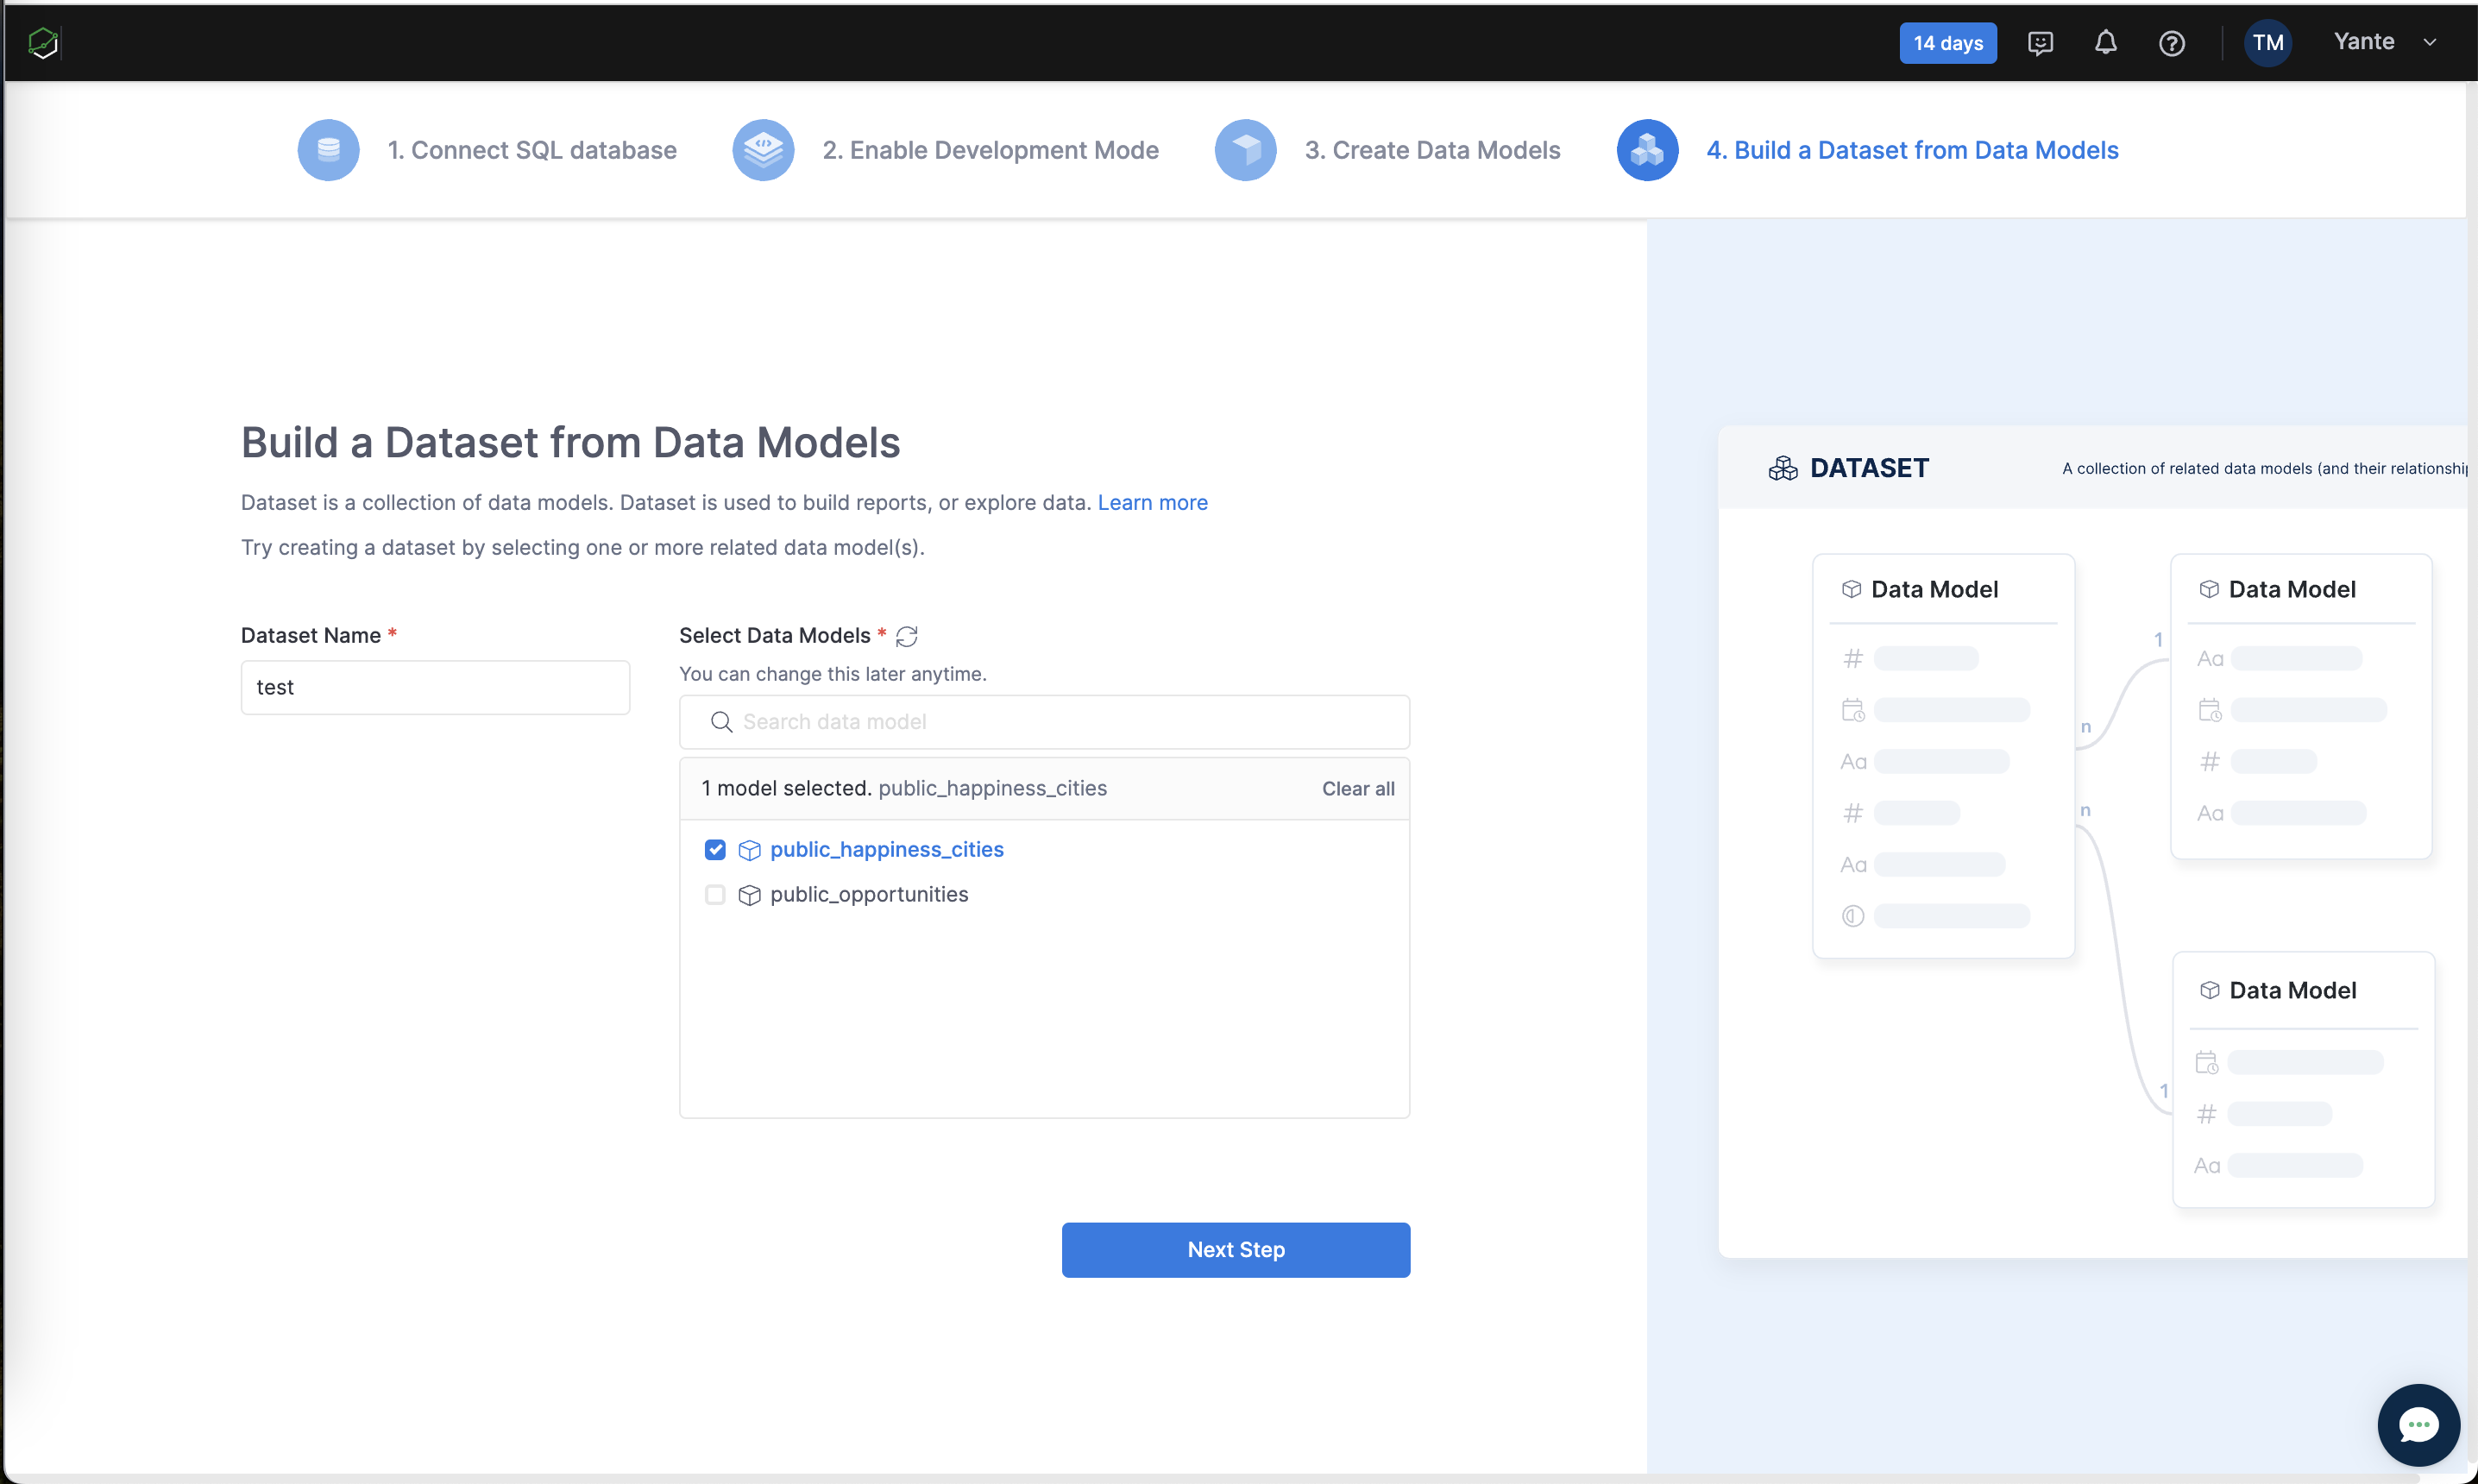
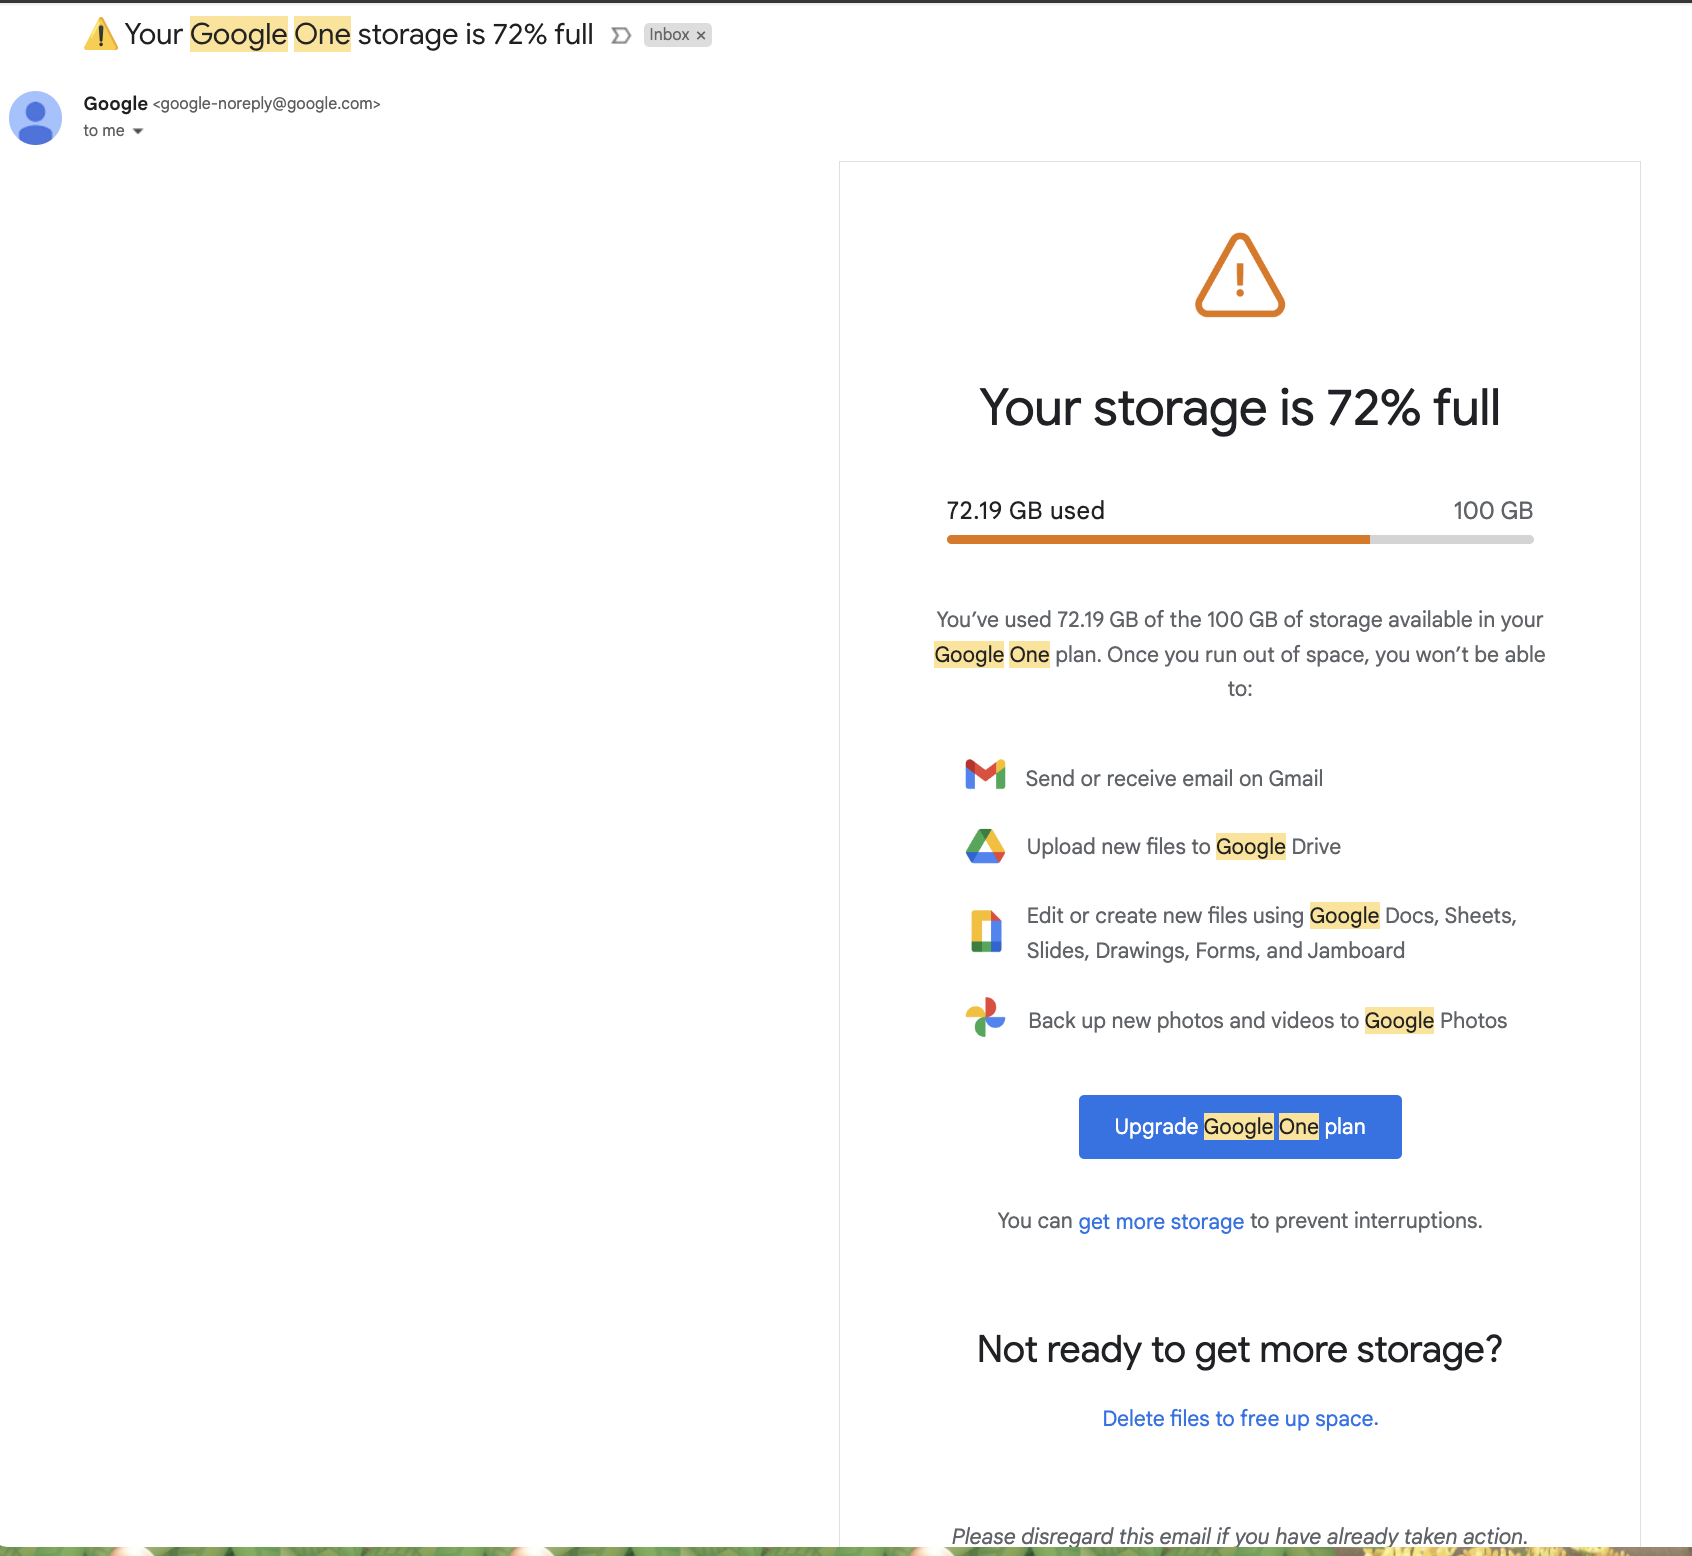
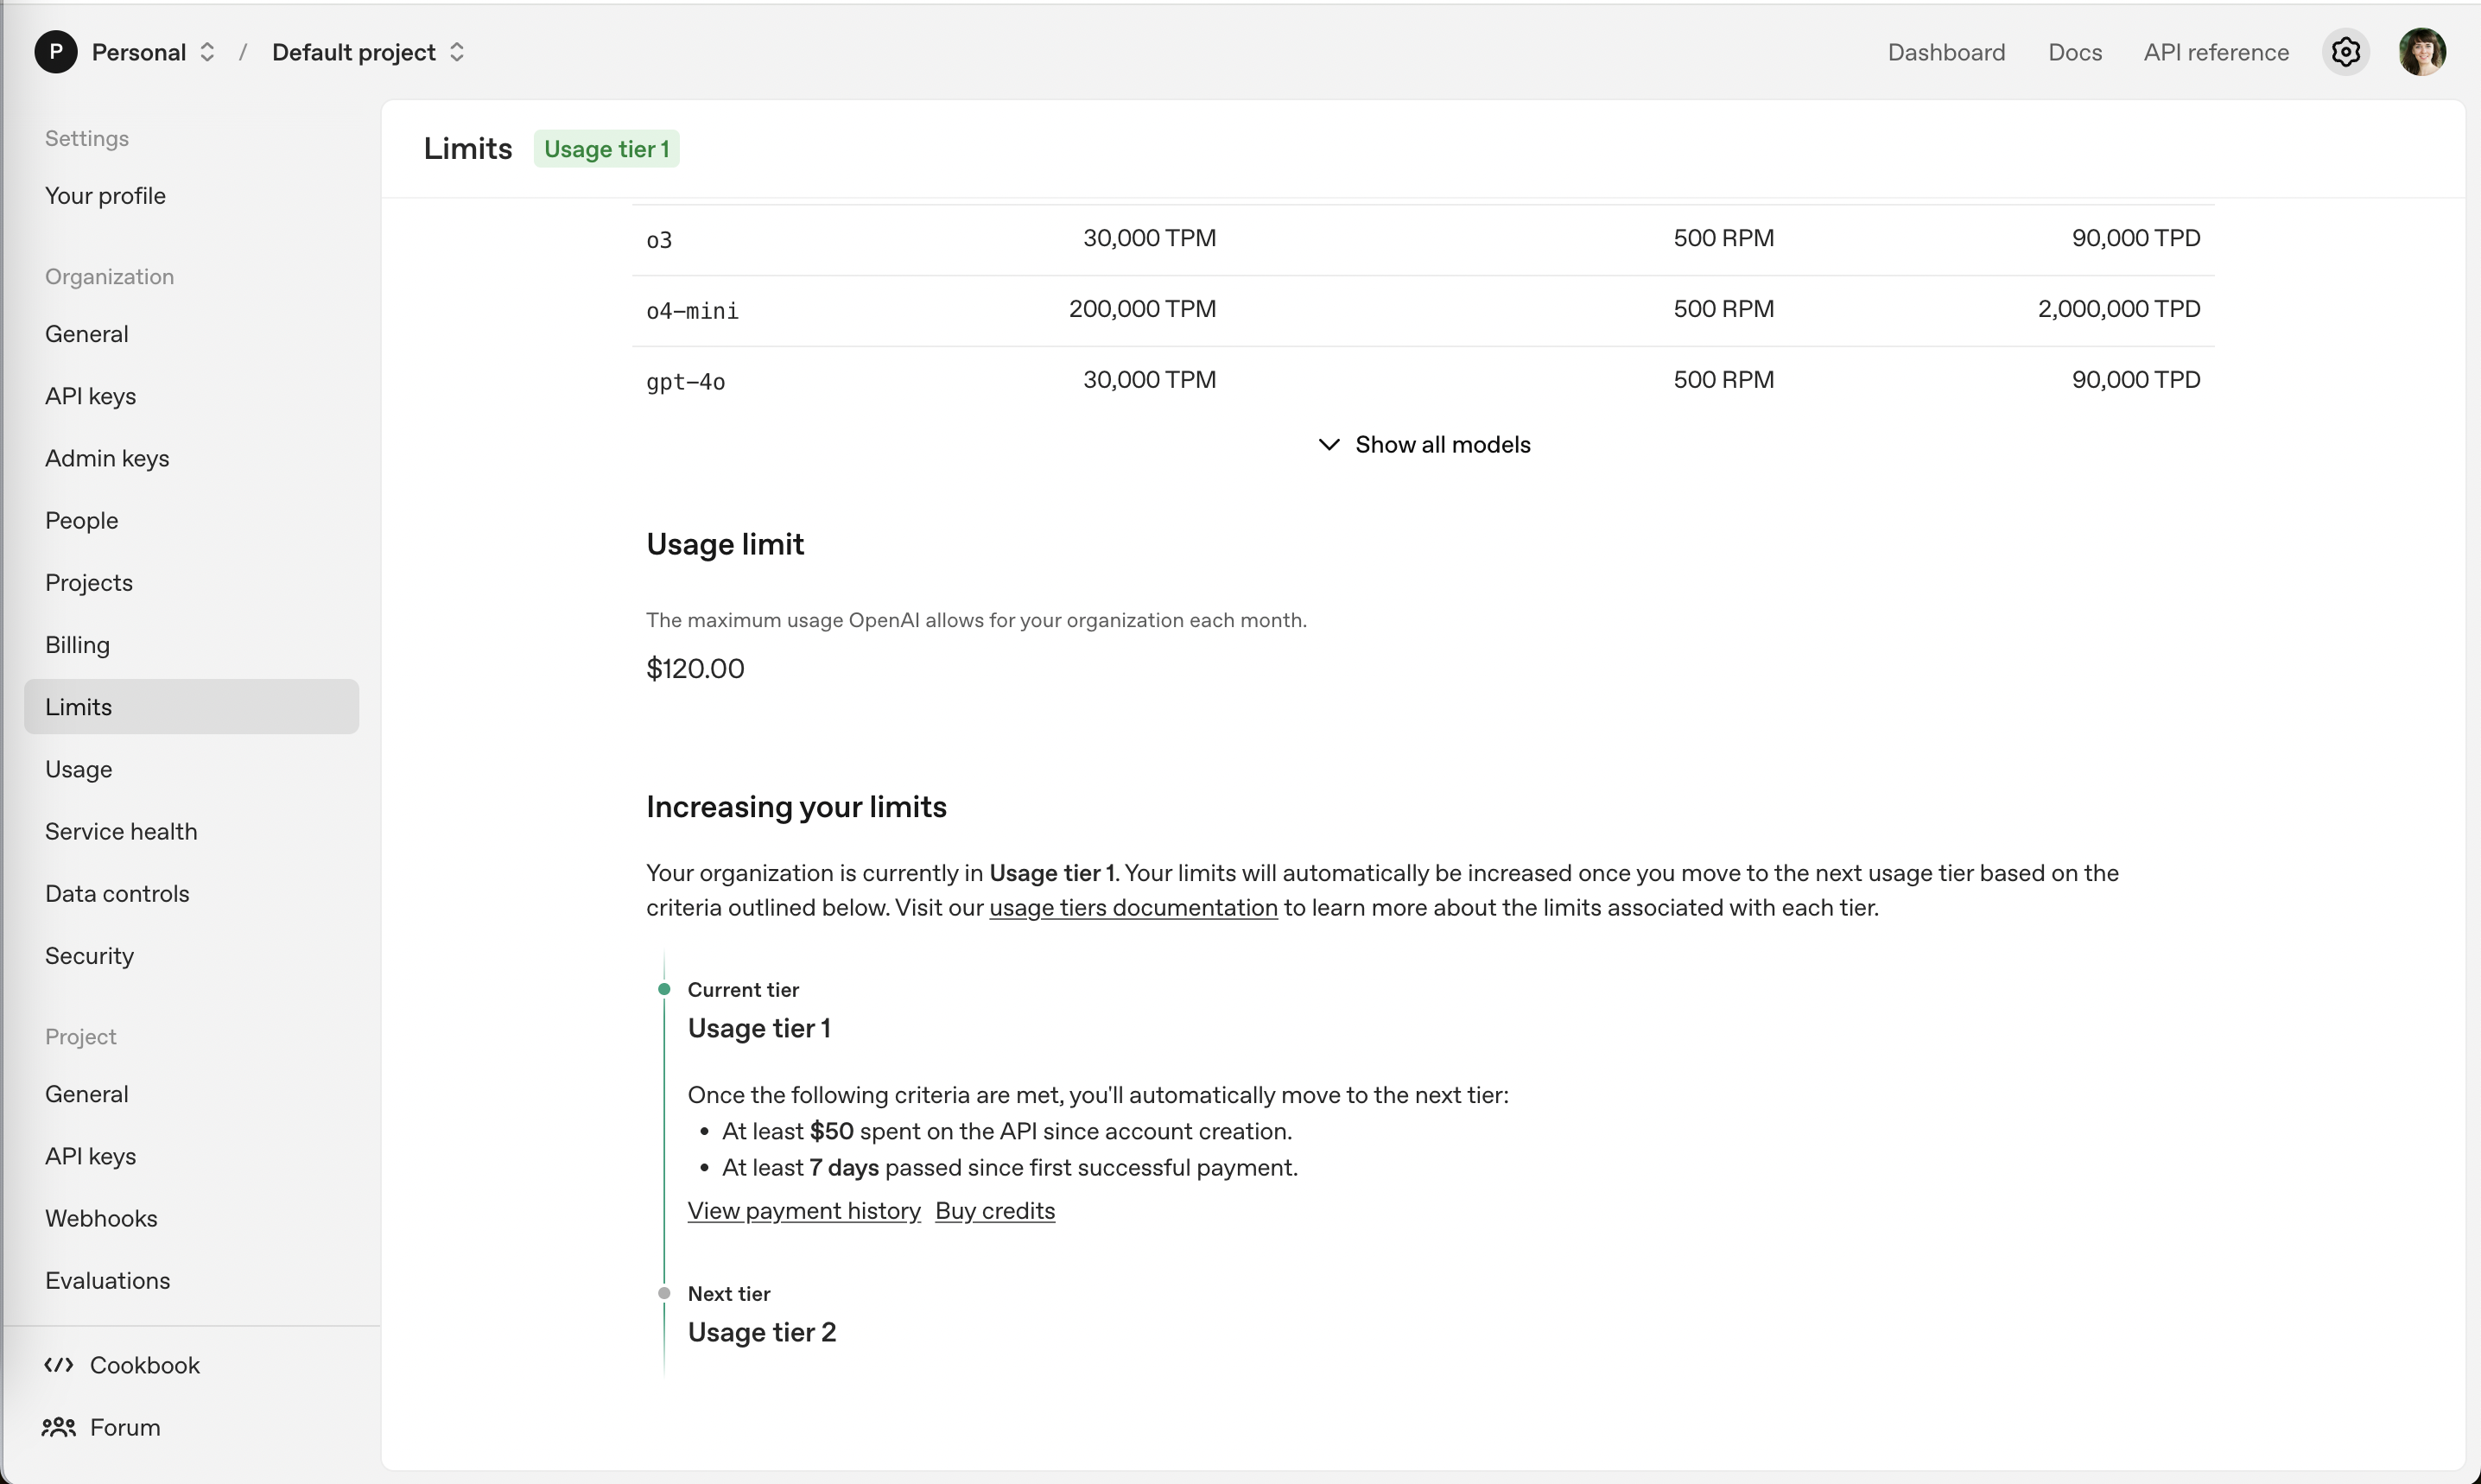
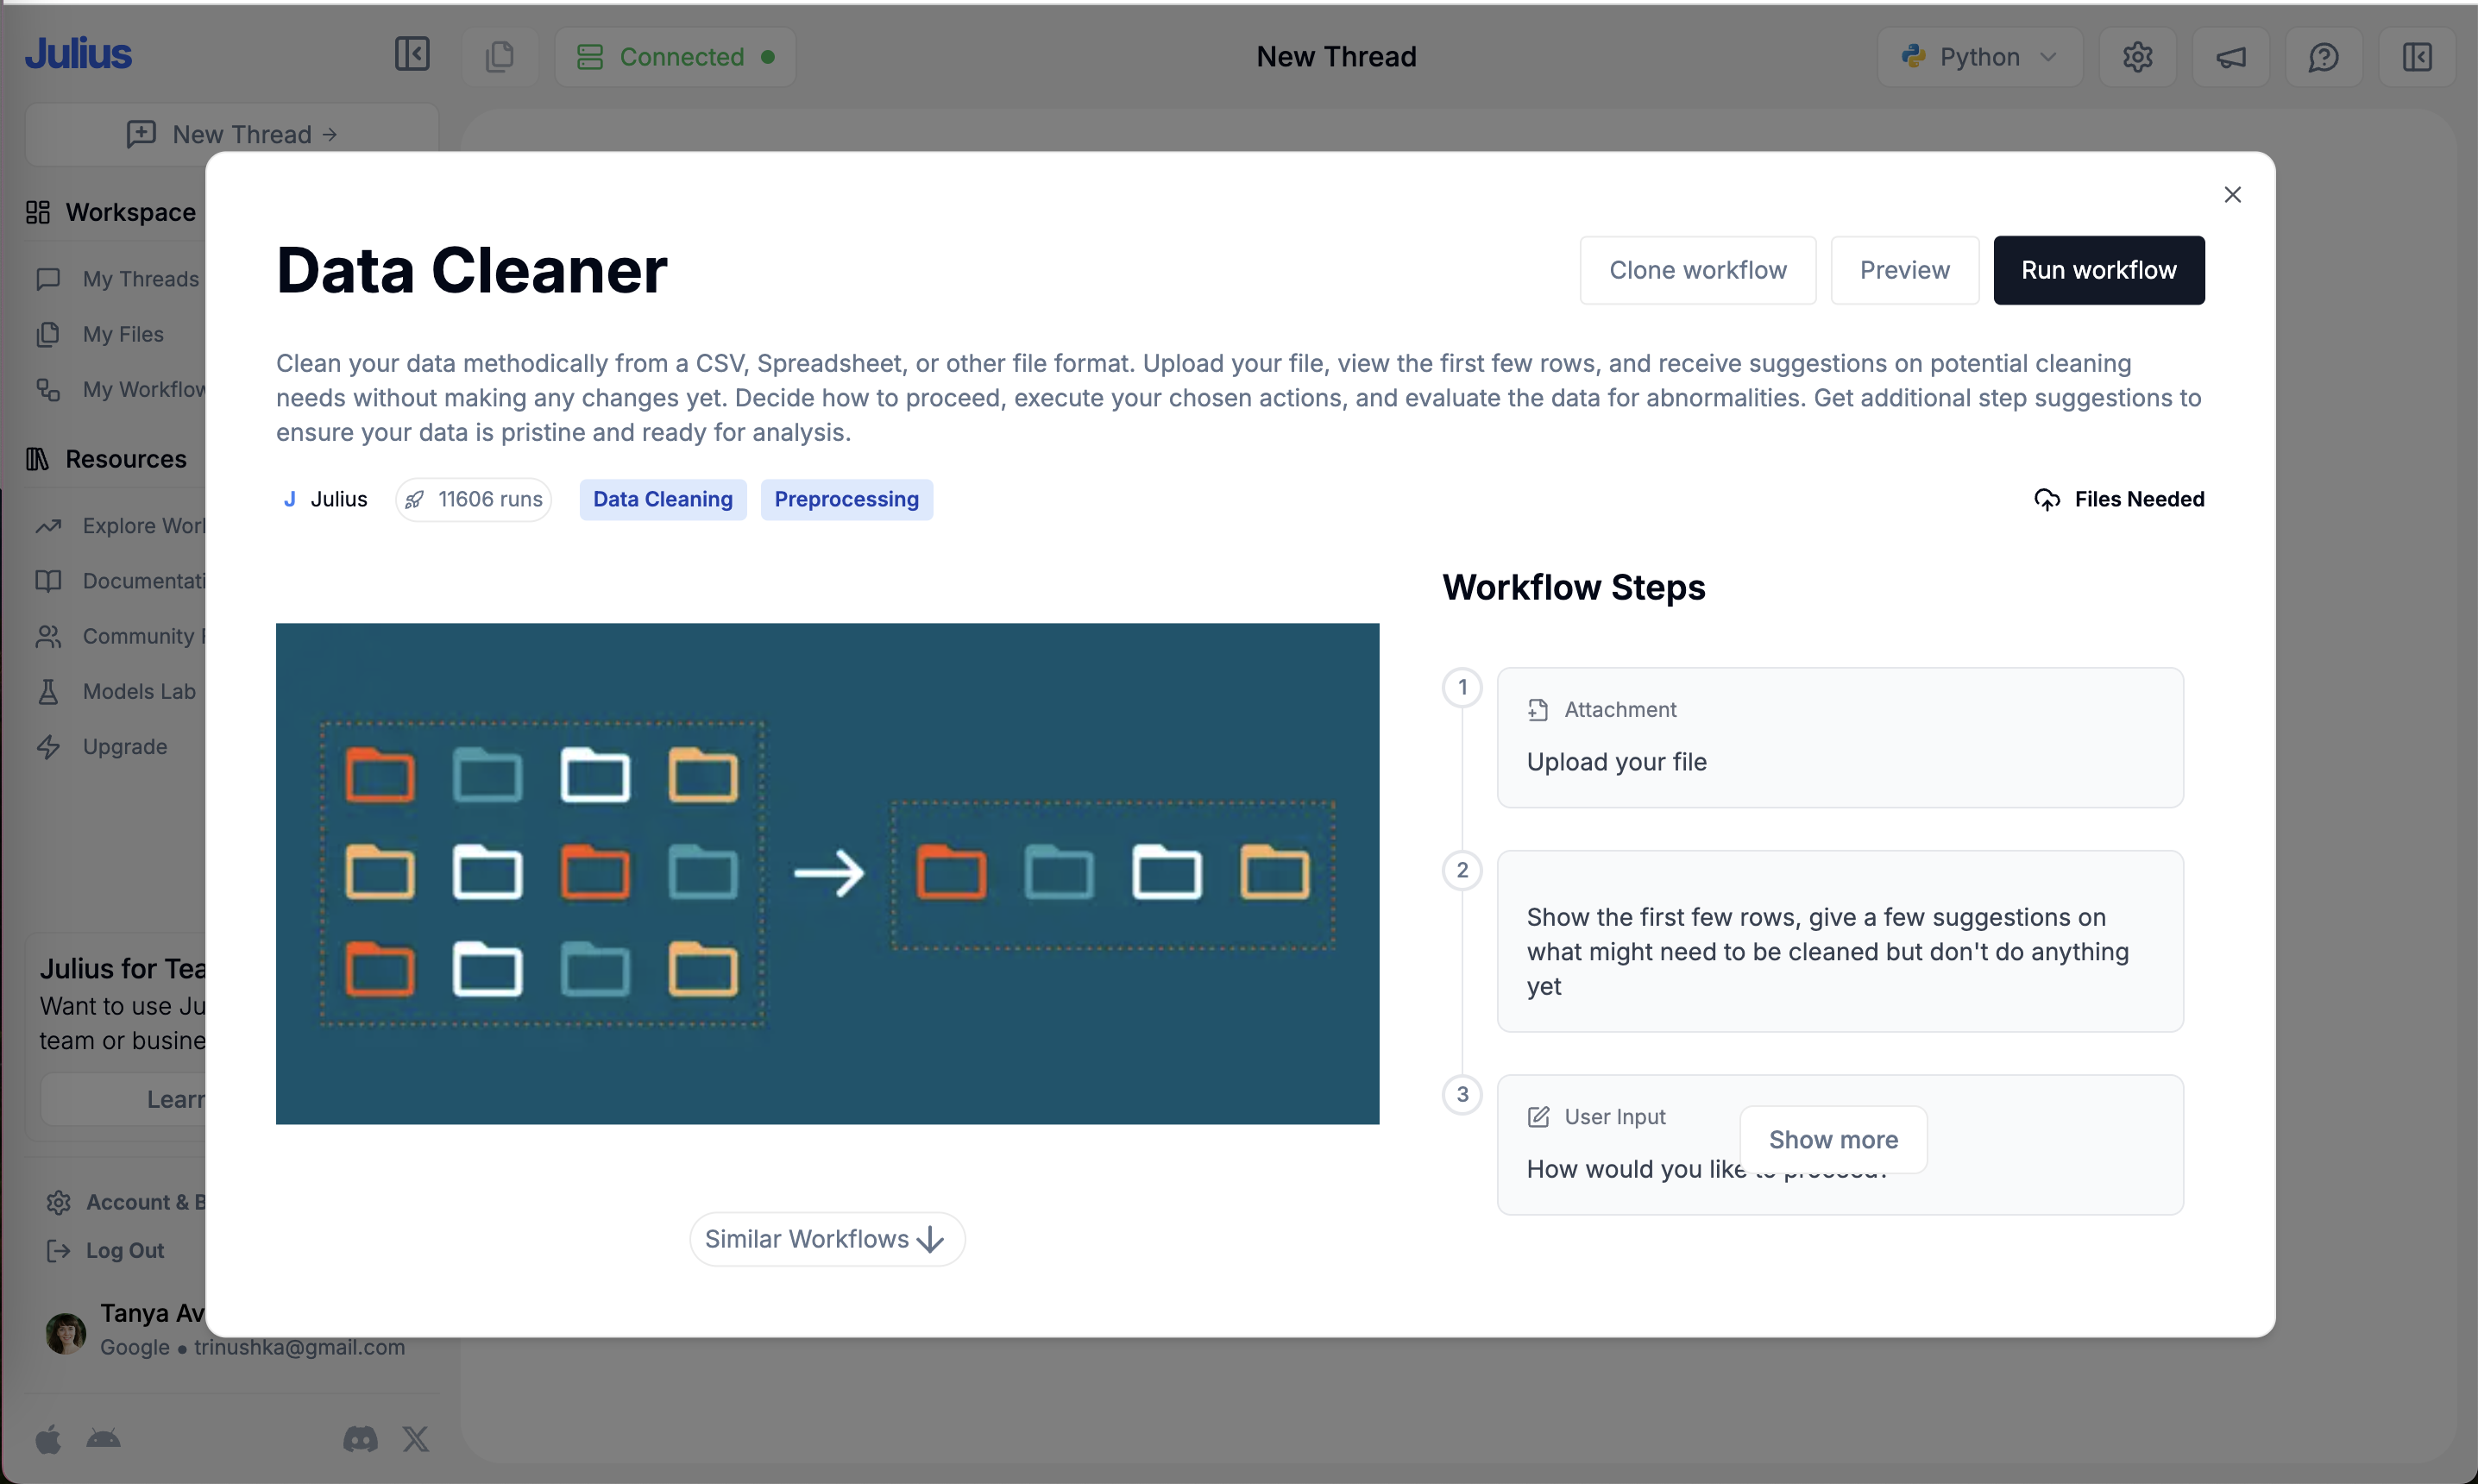
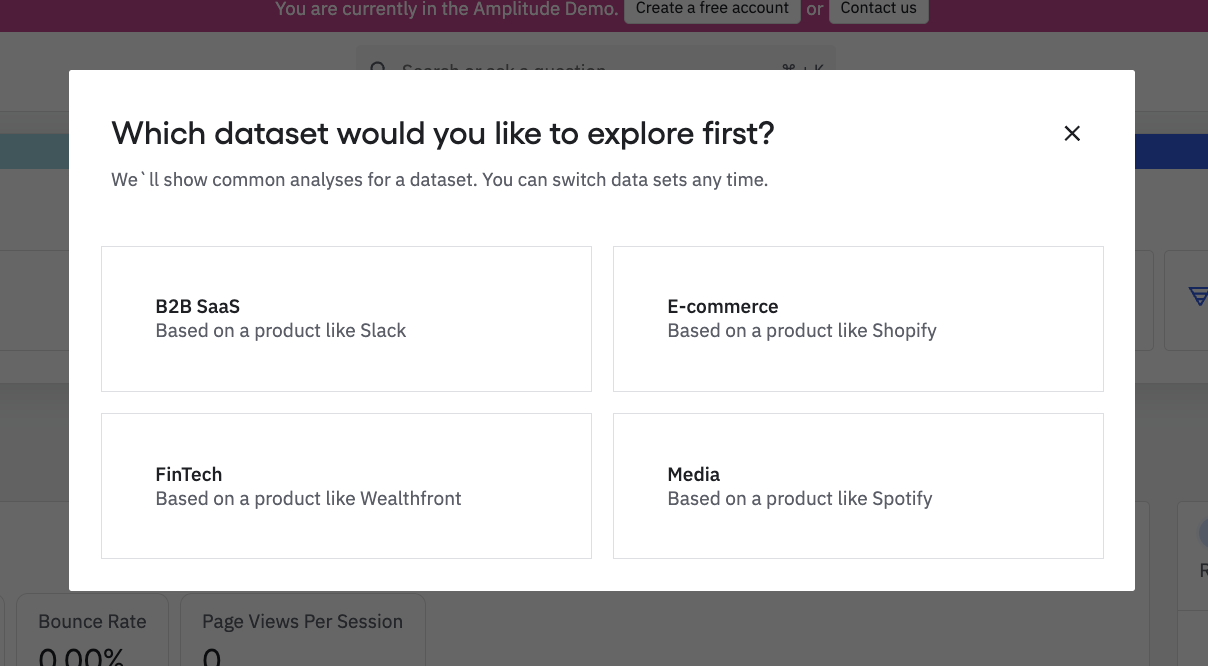
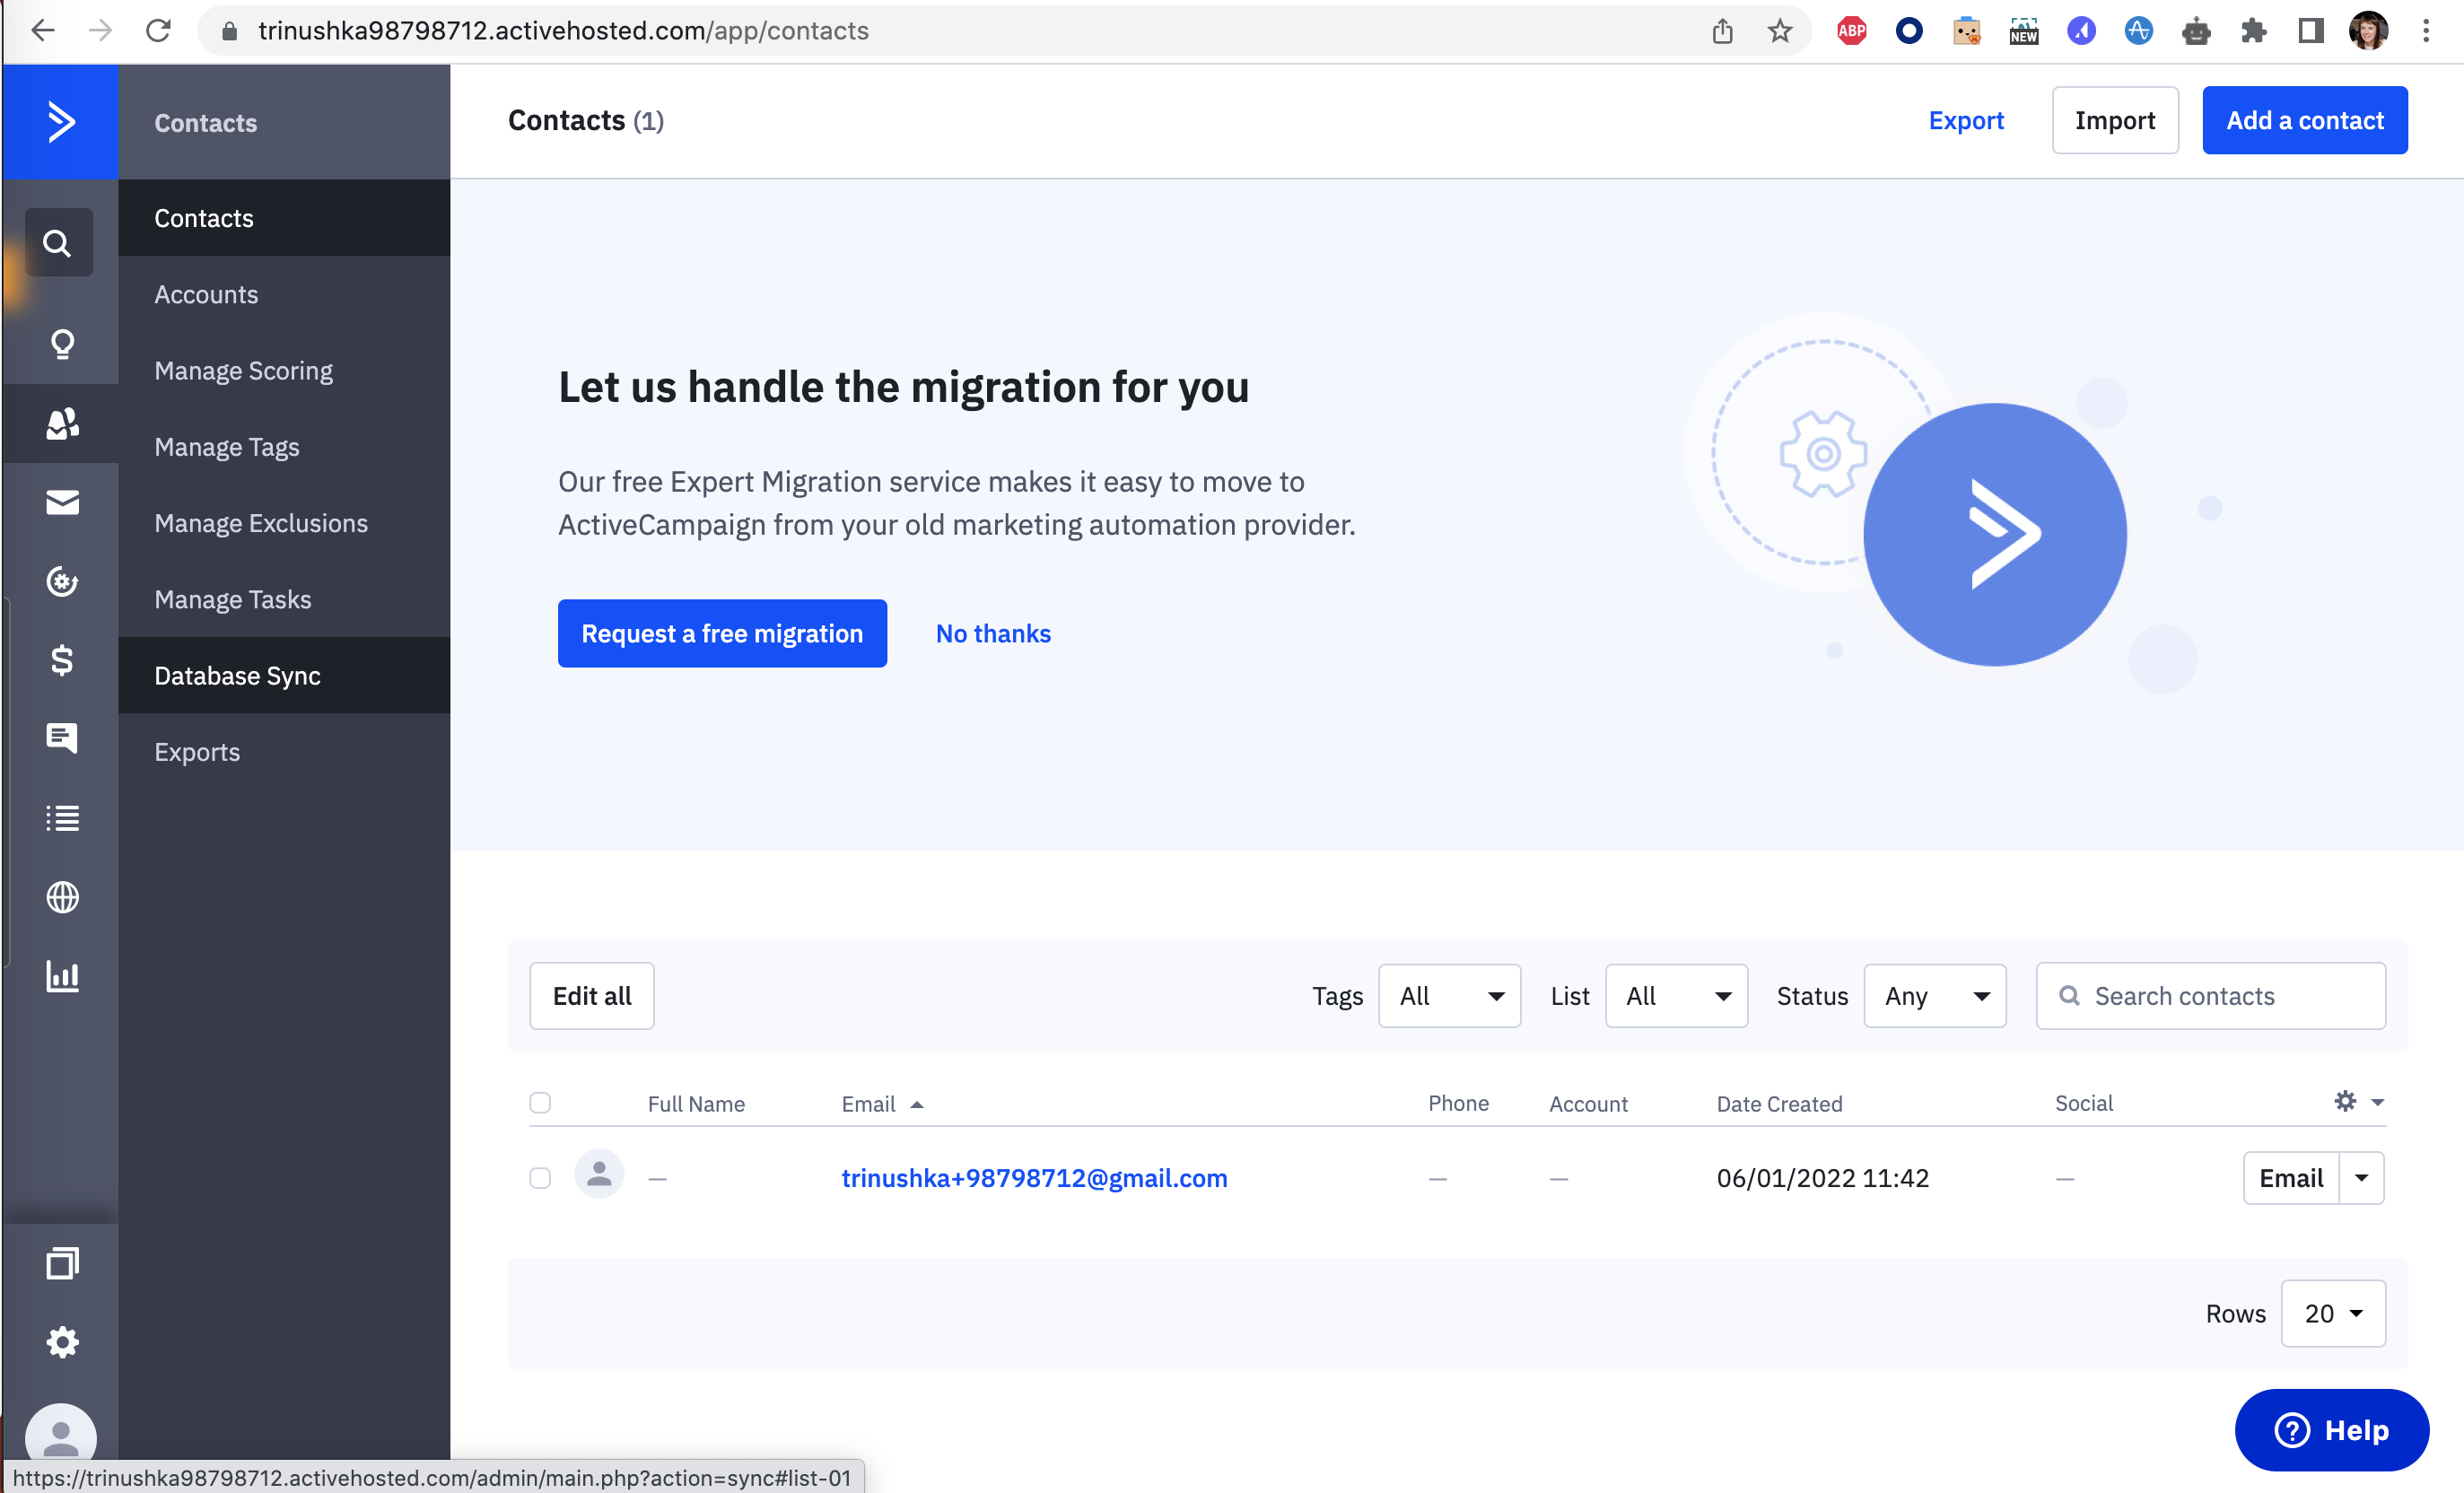
Show, don't tell in real products 27 working · 6 not

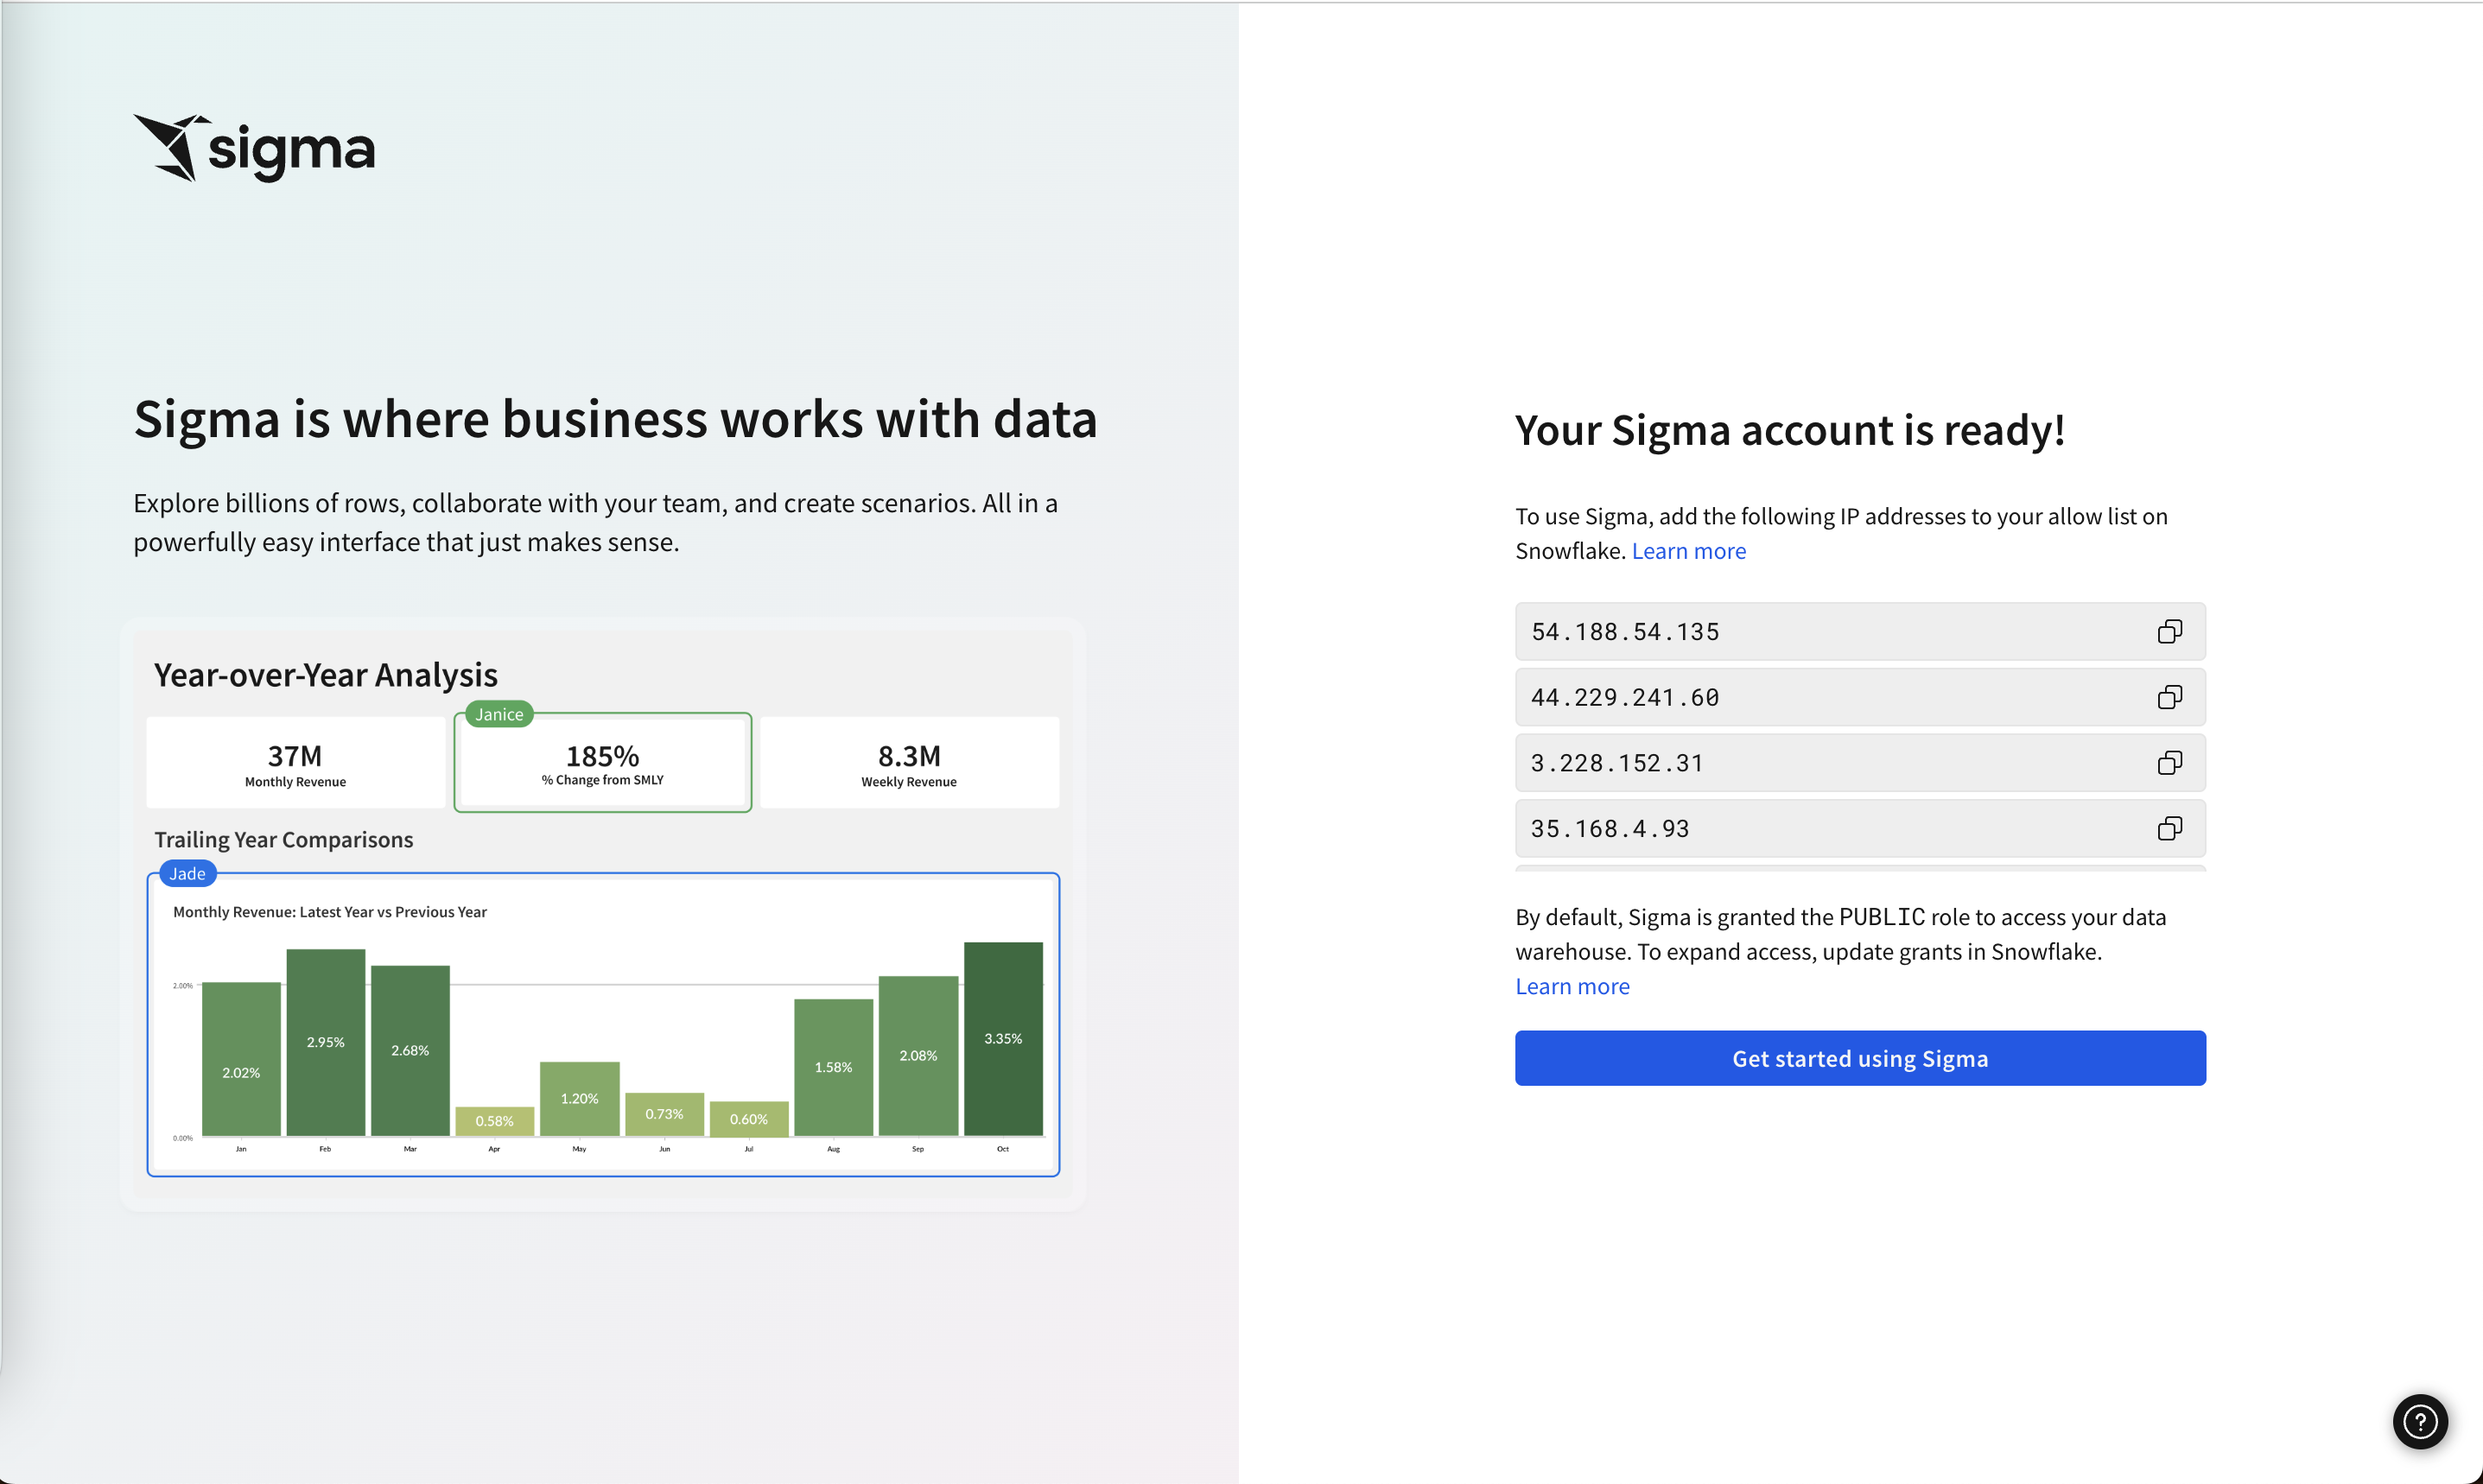
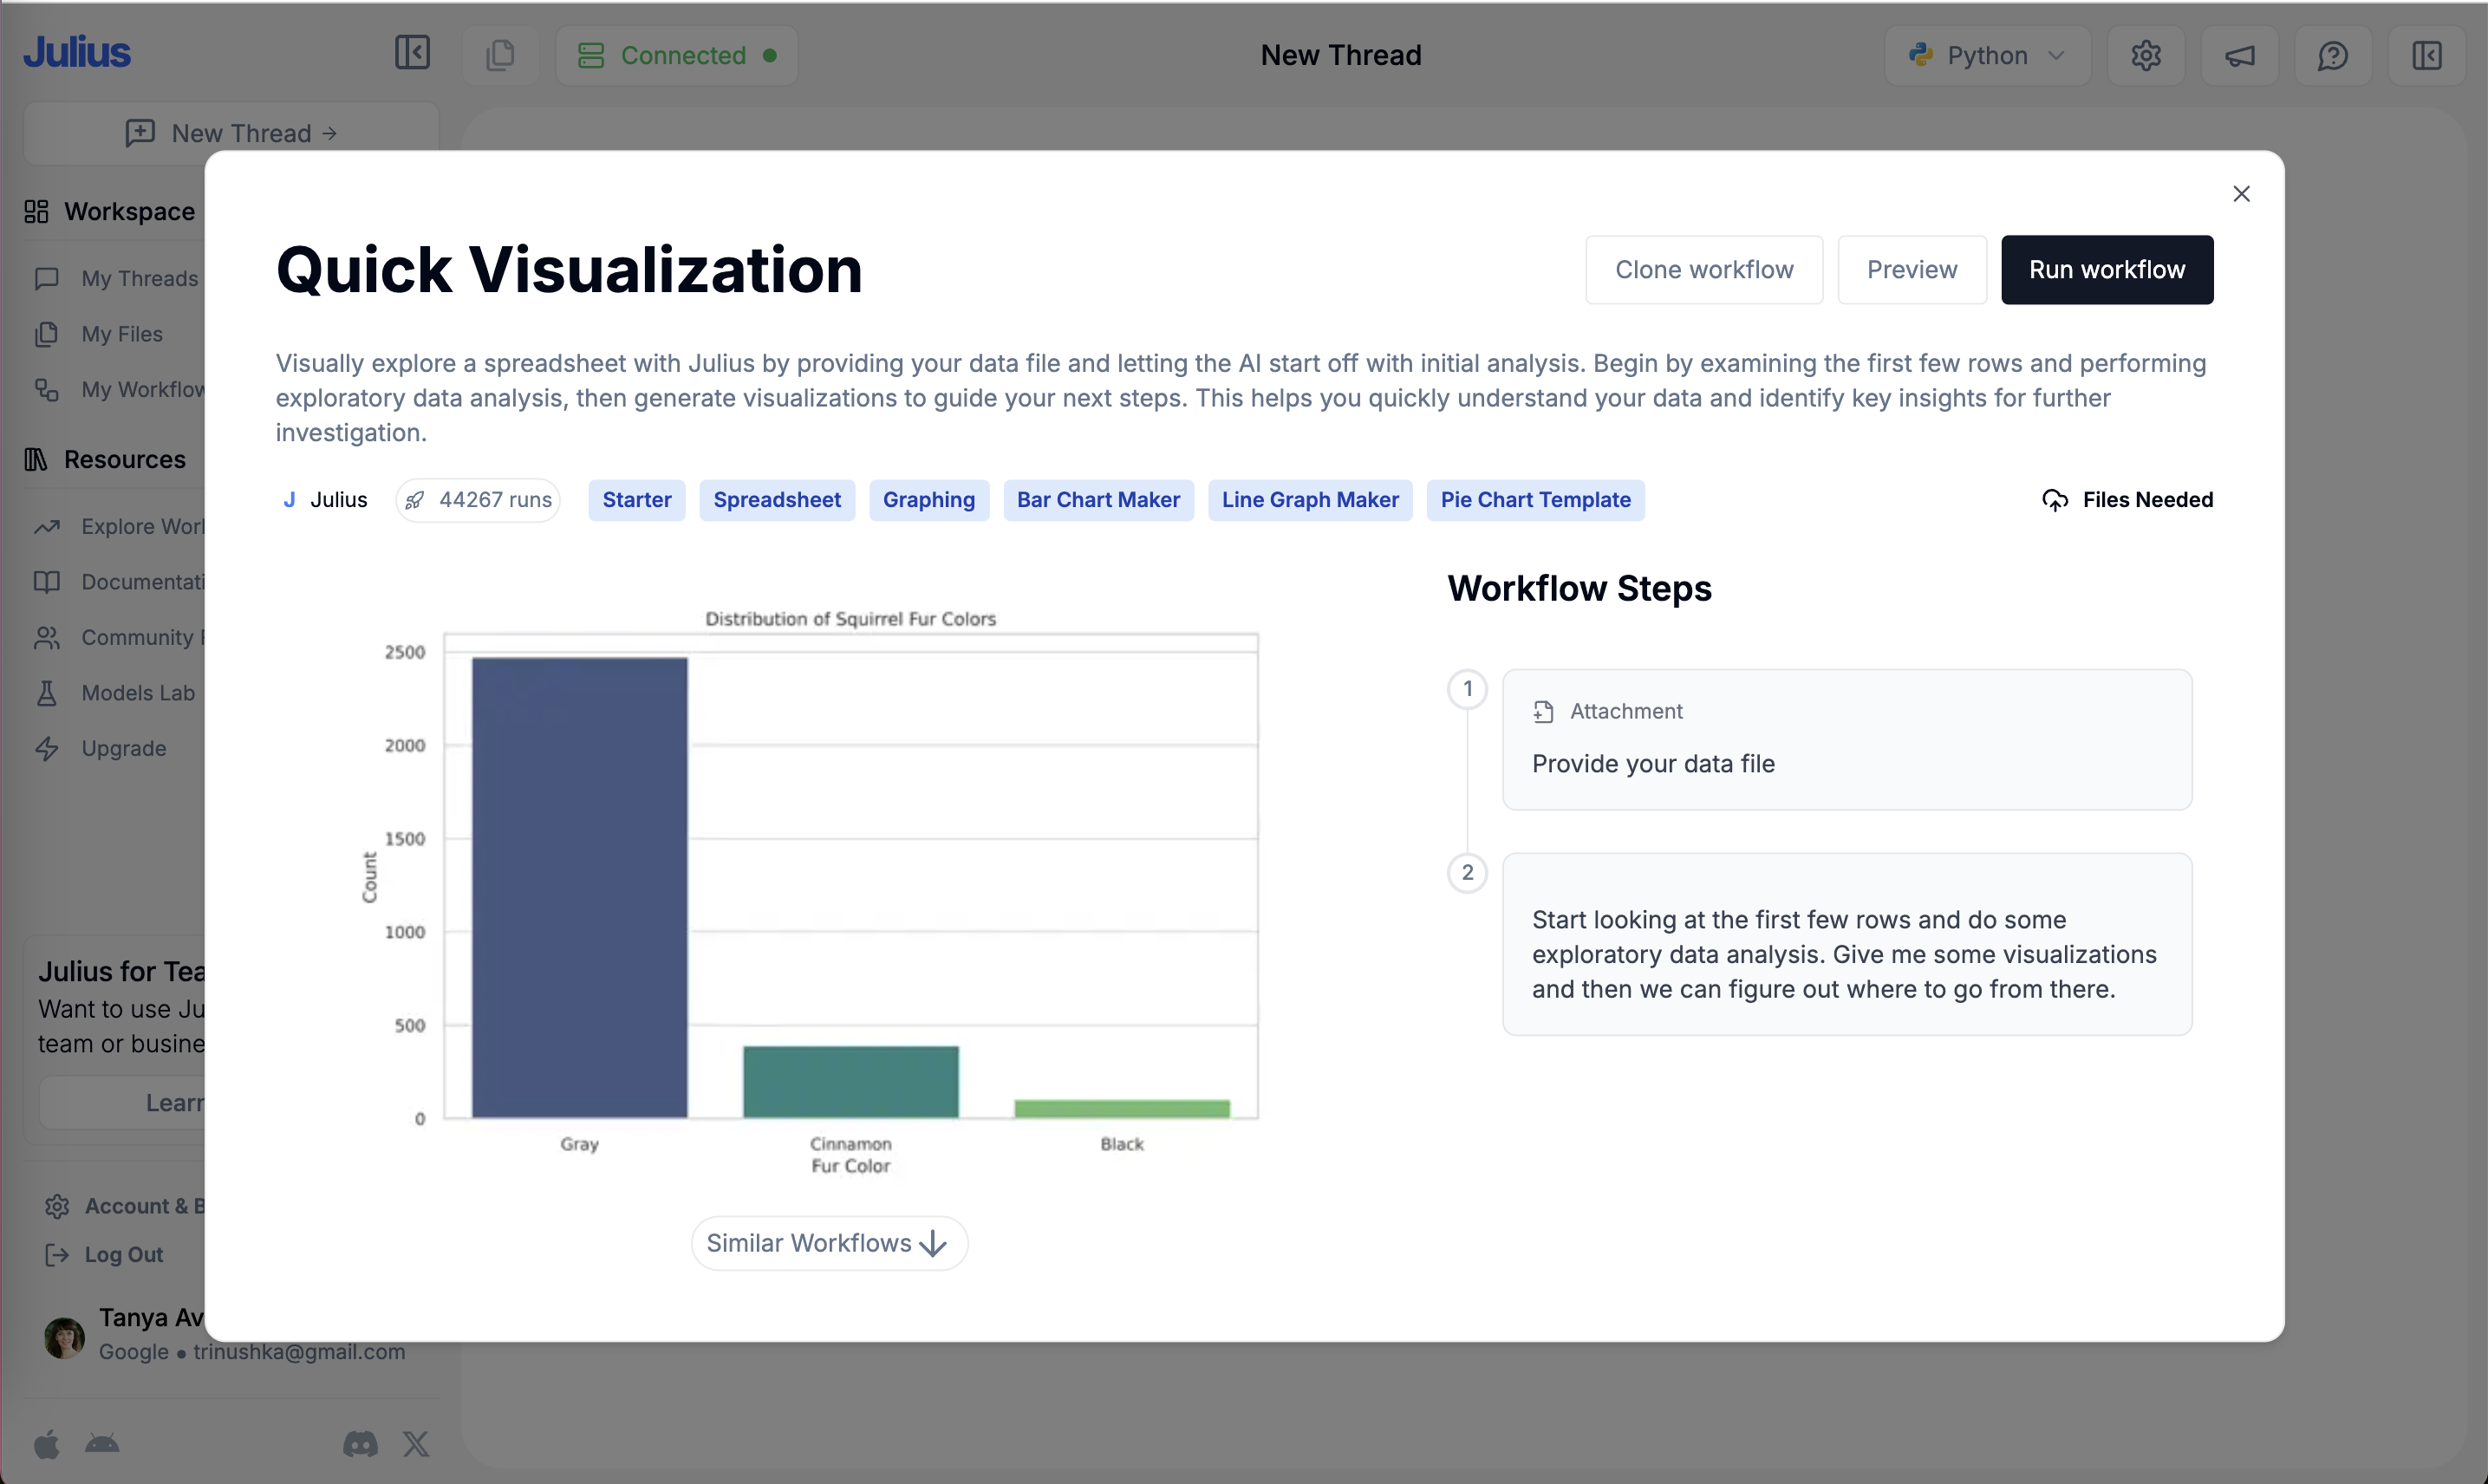
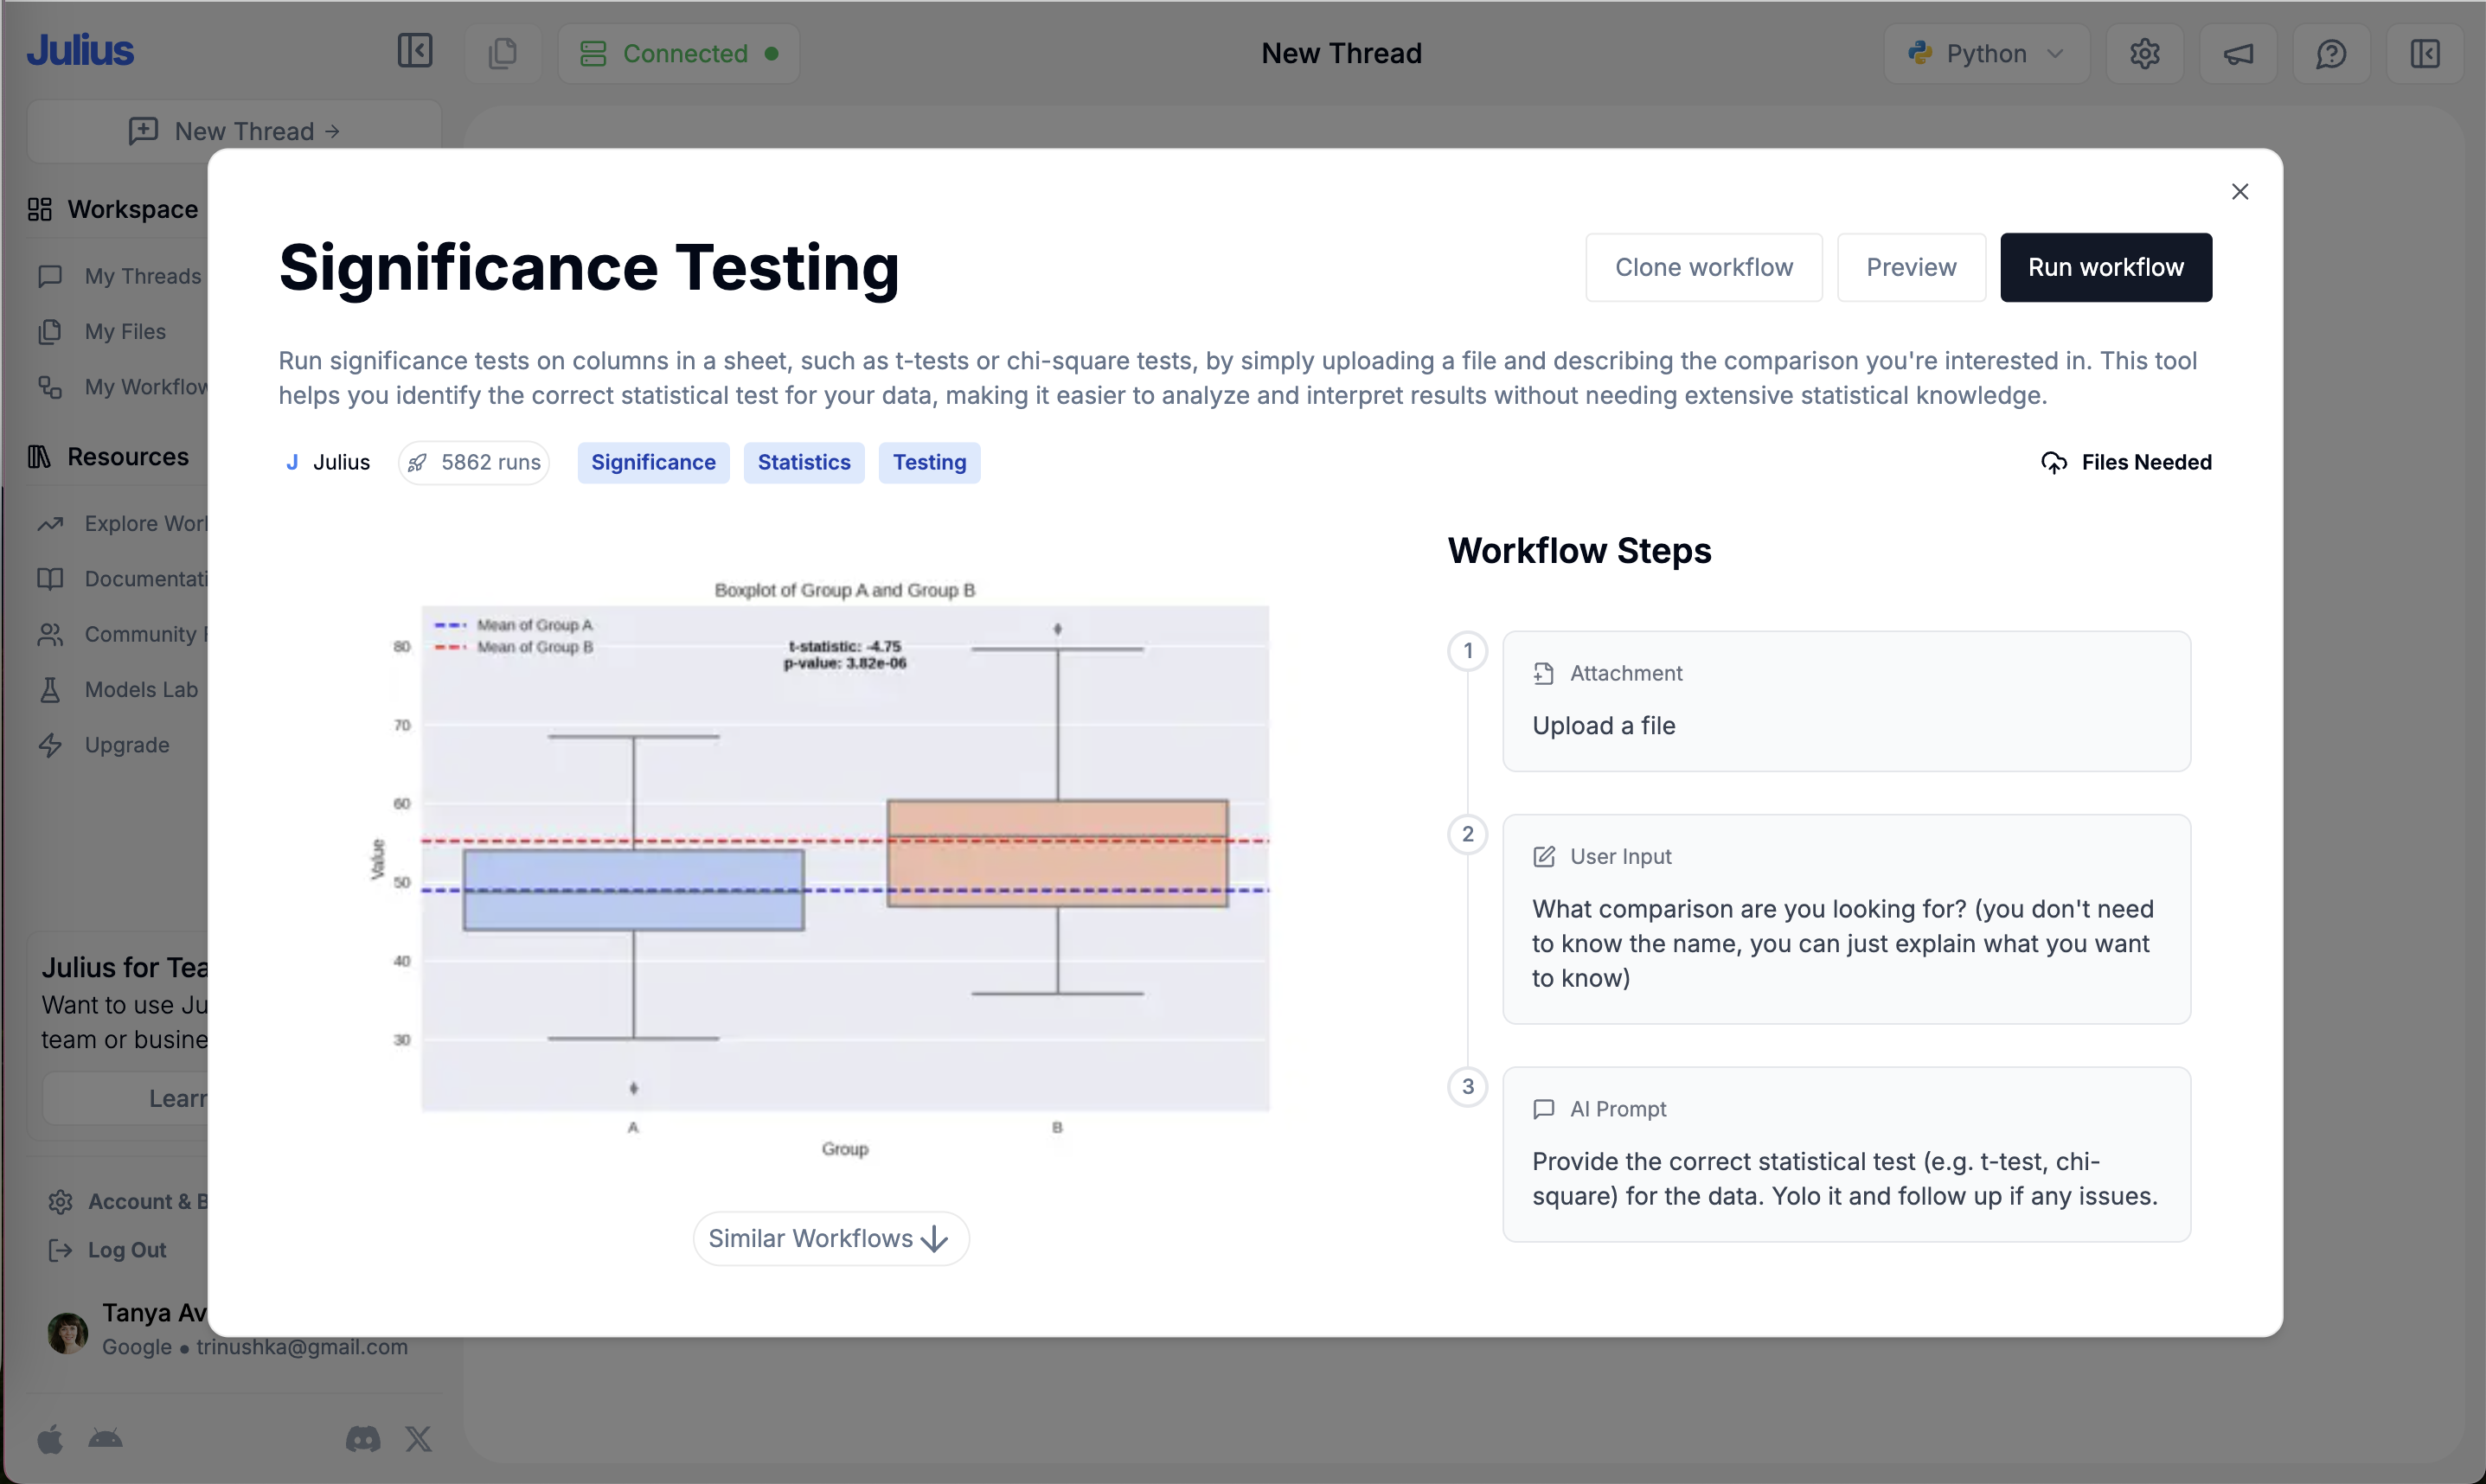
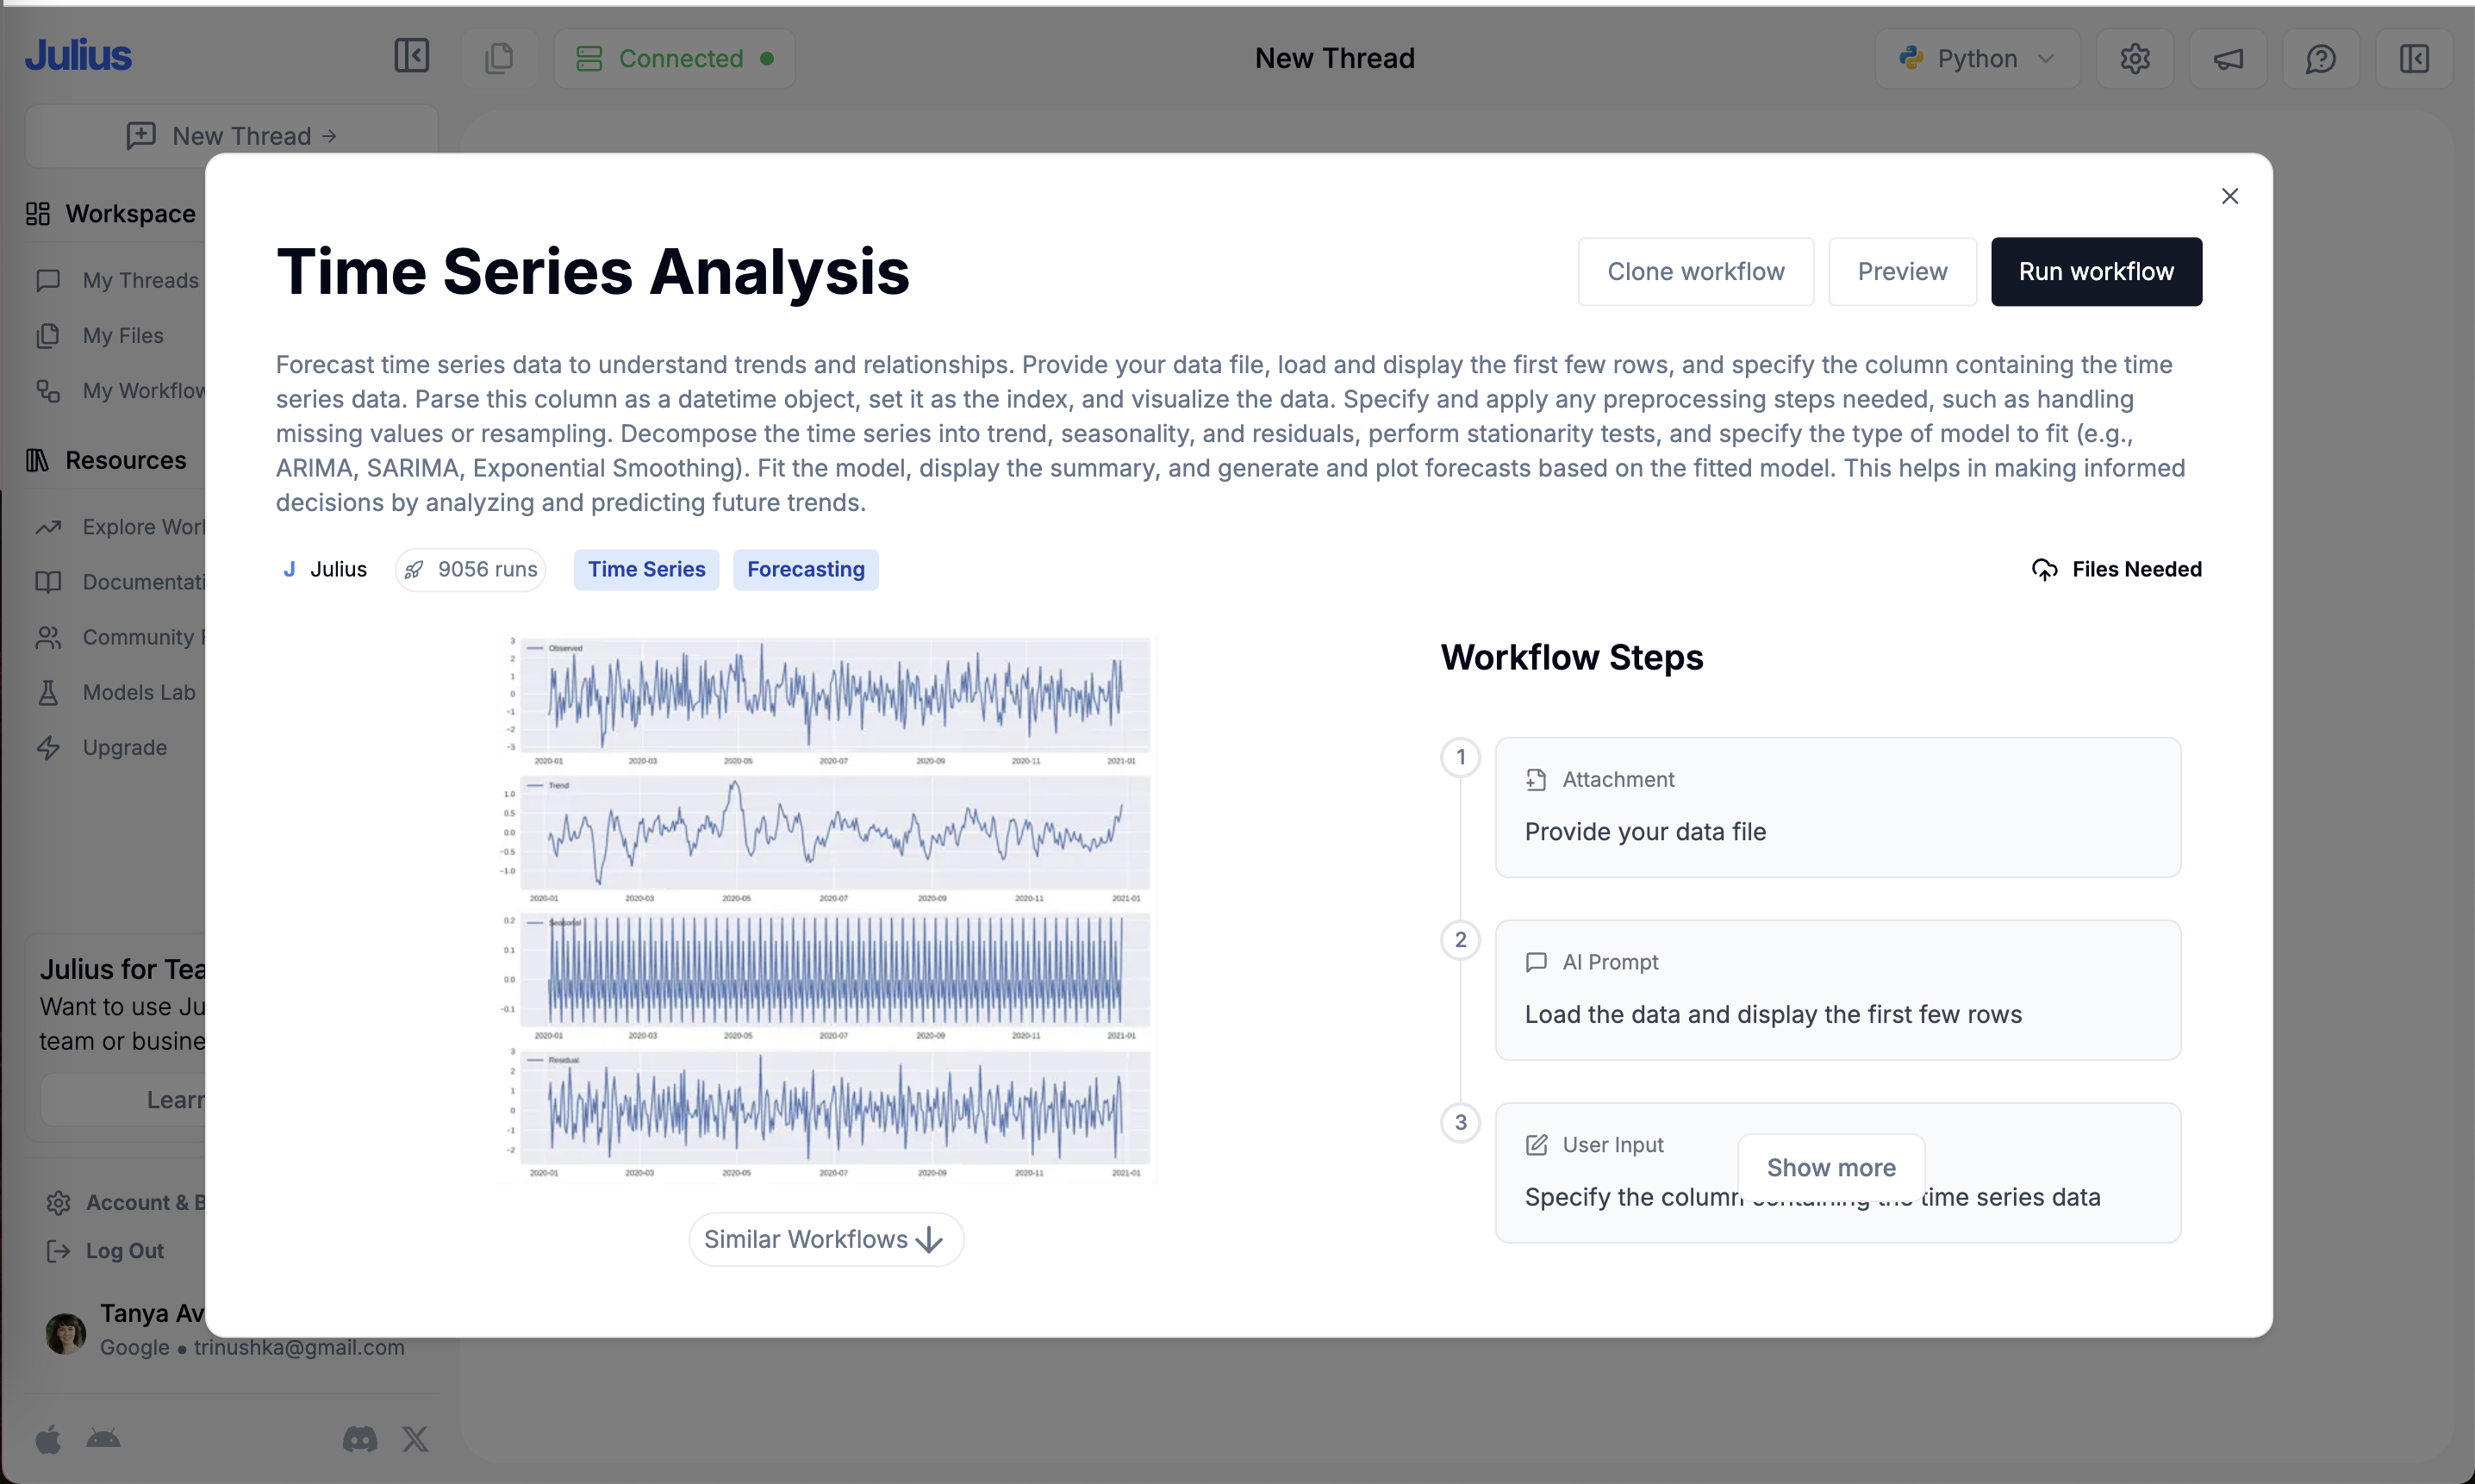
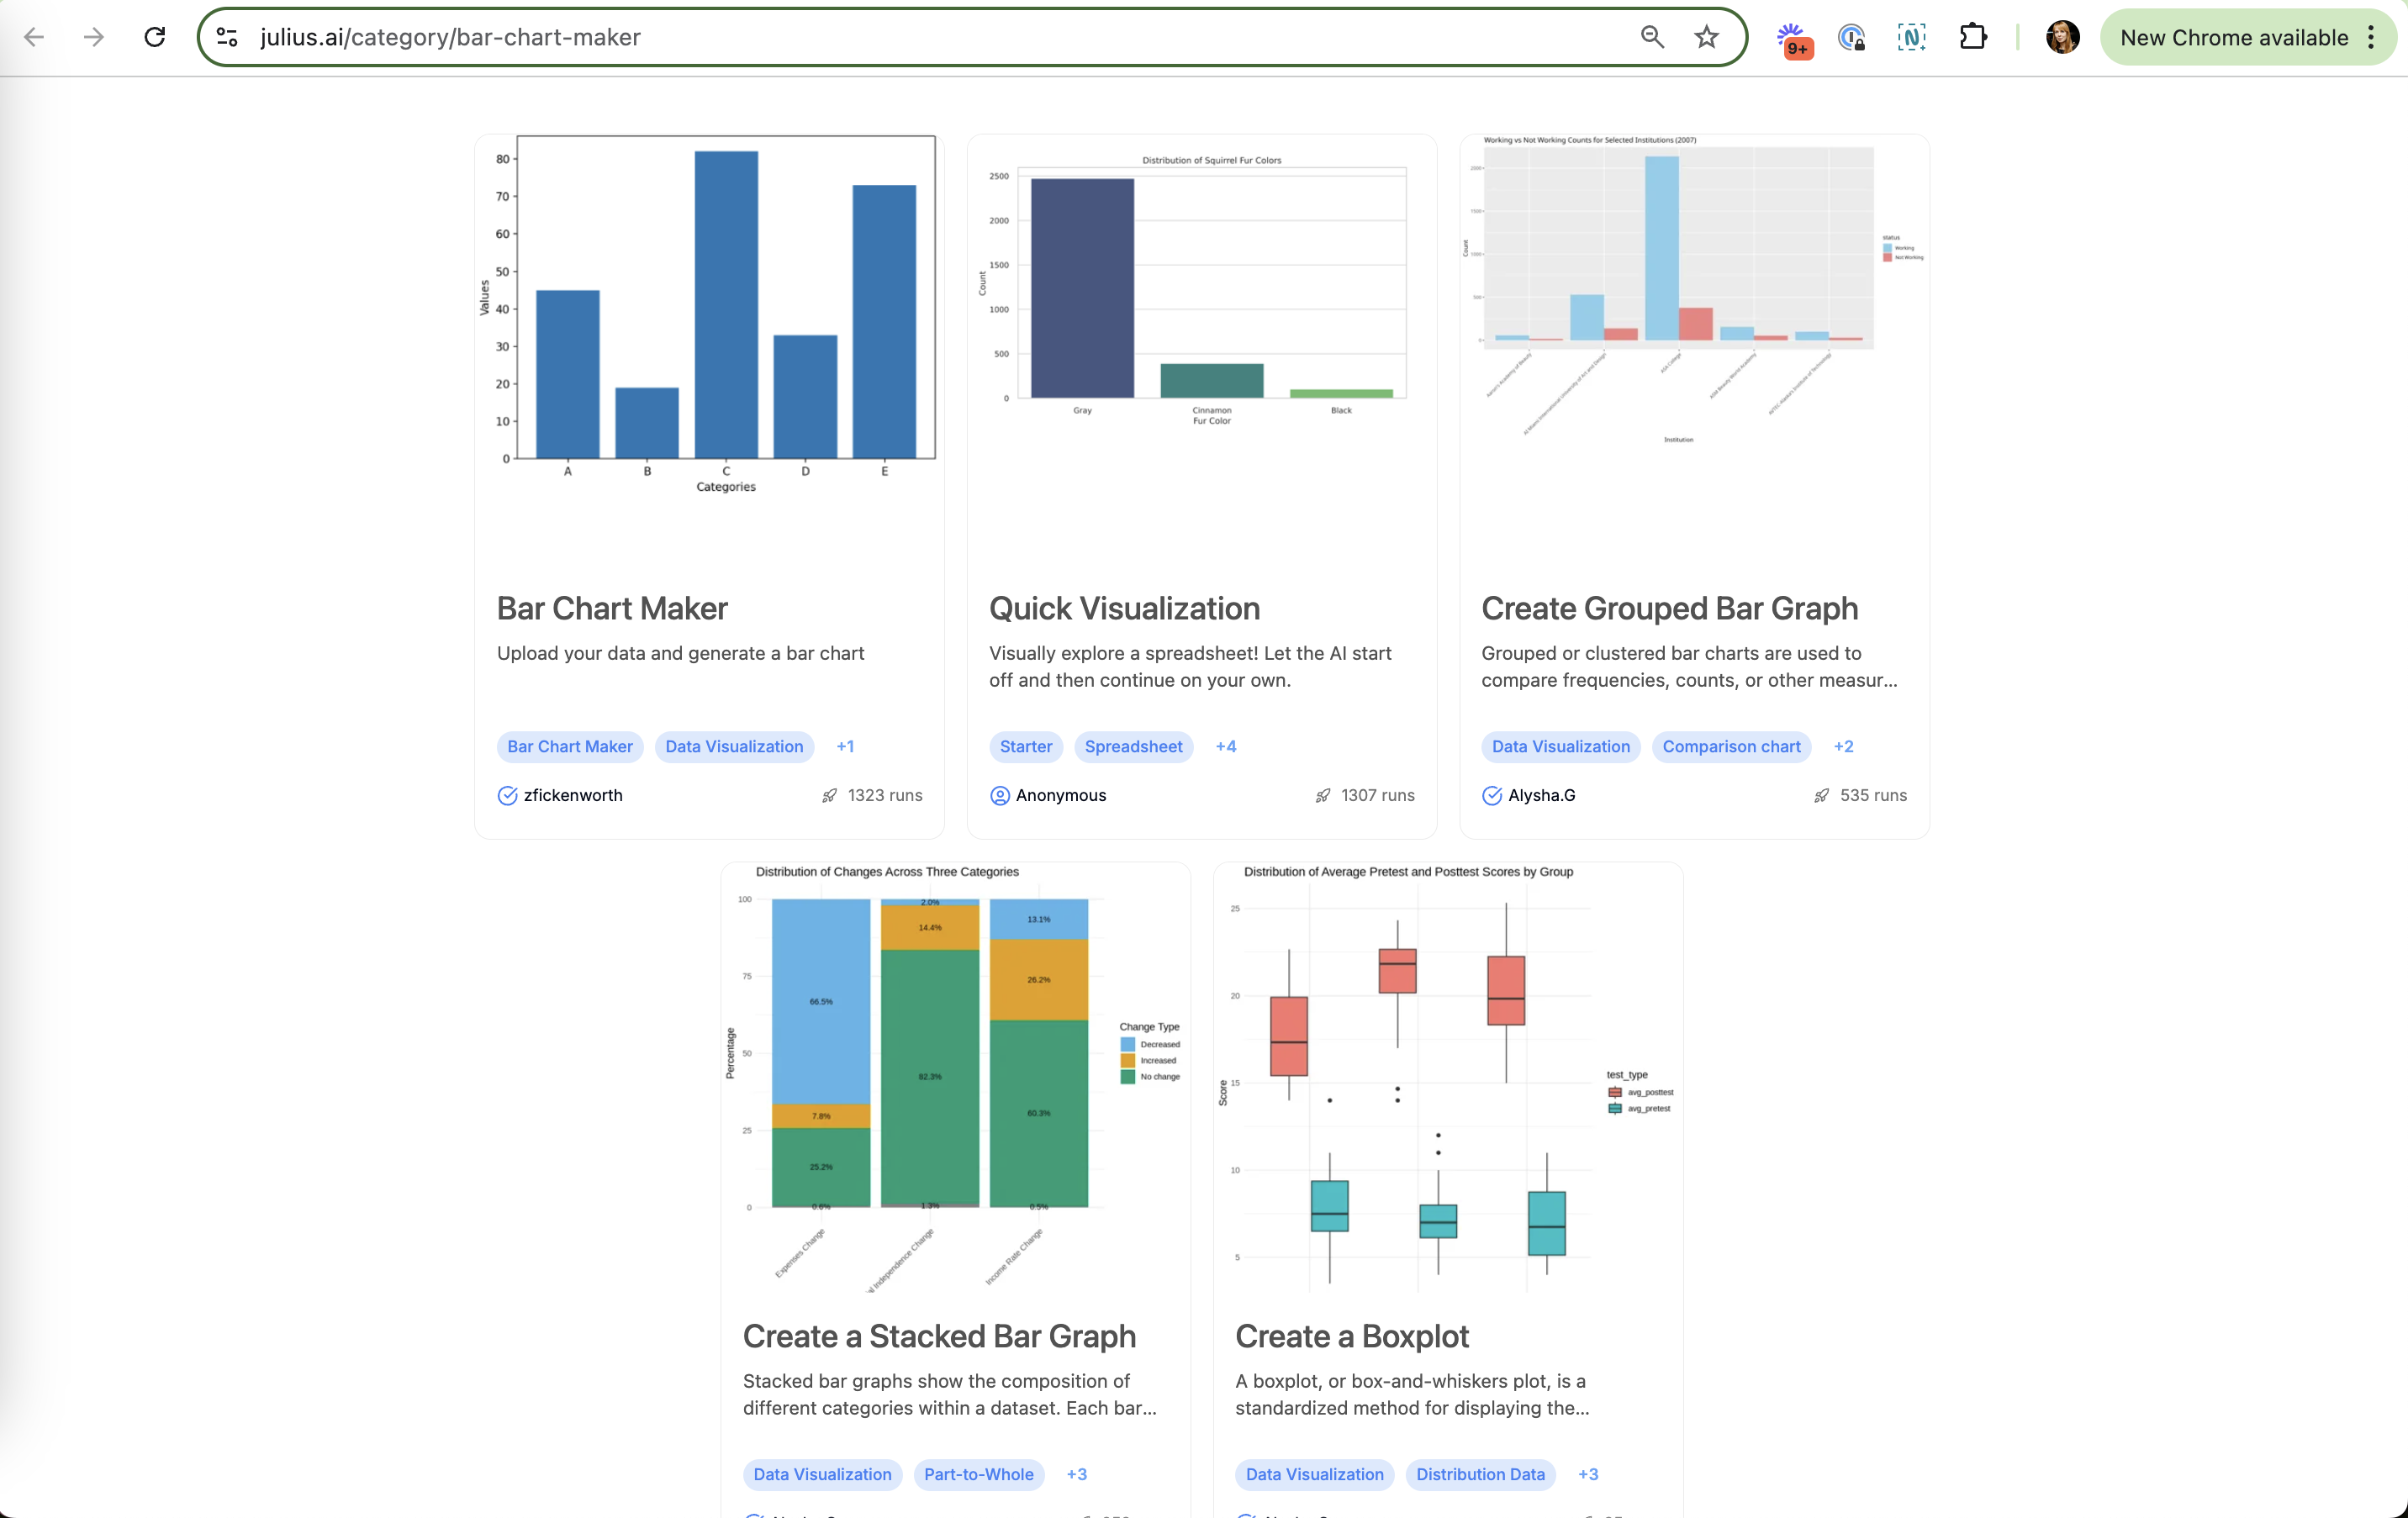
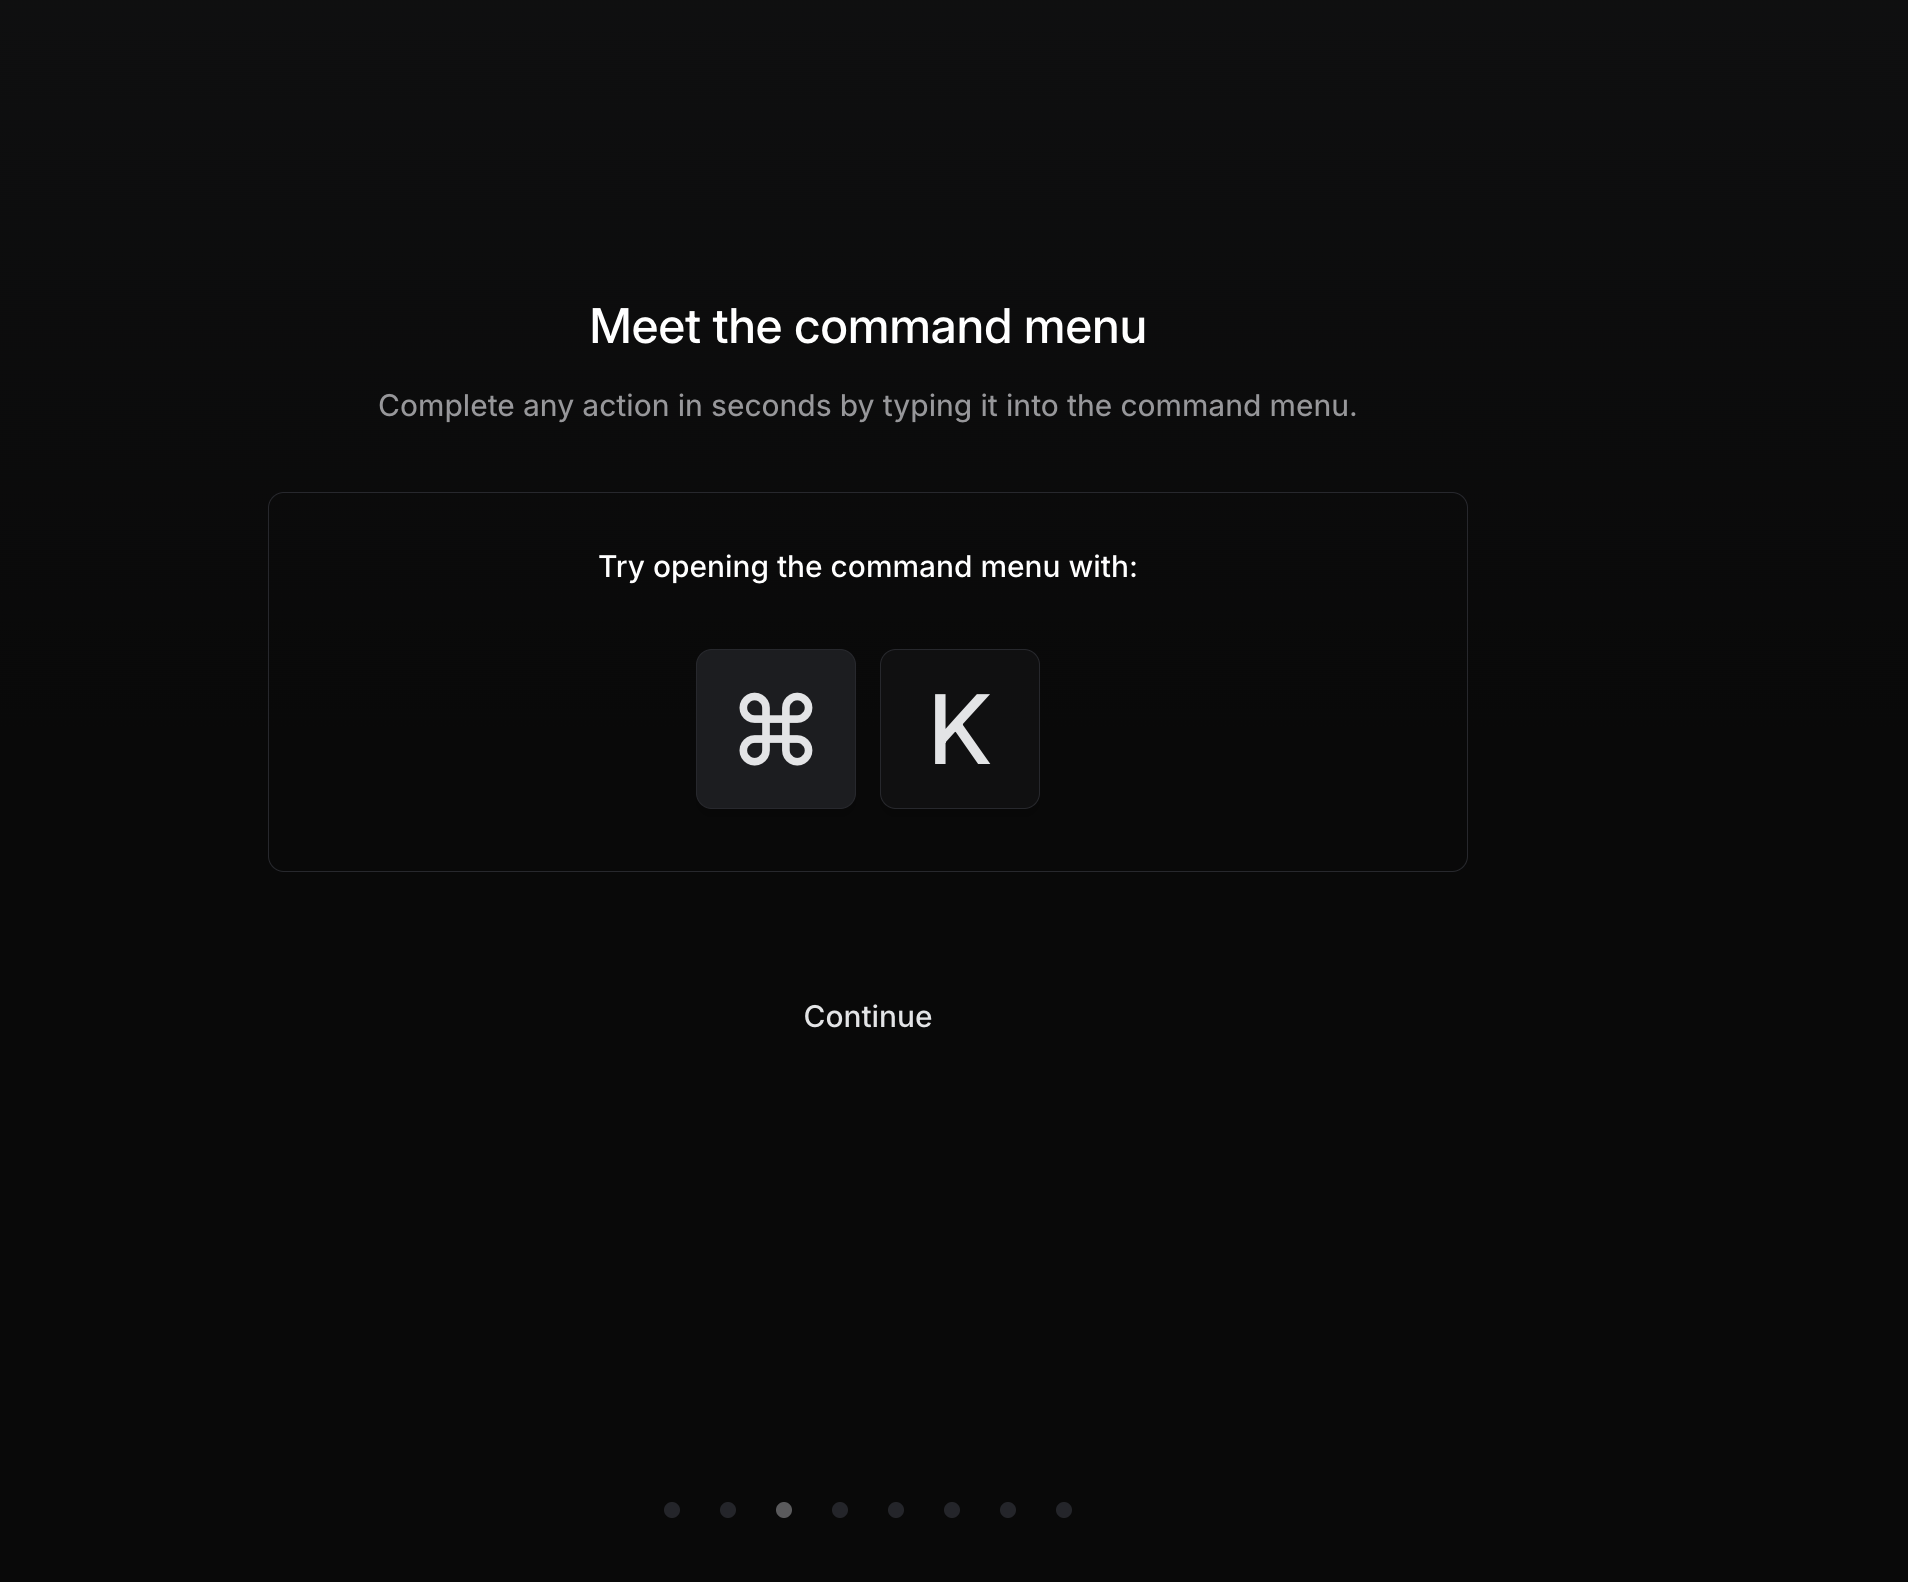
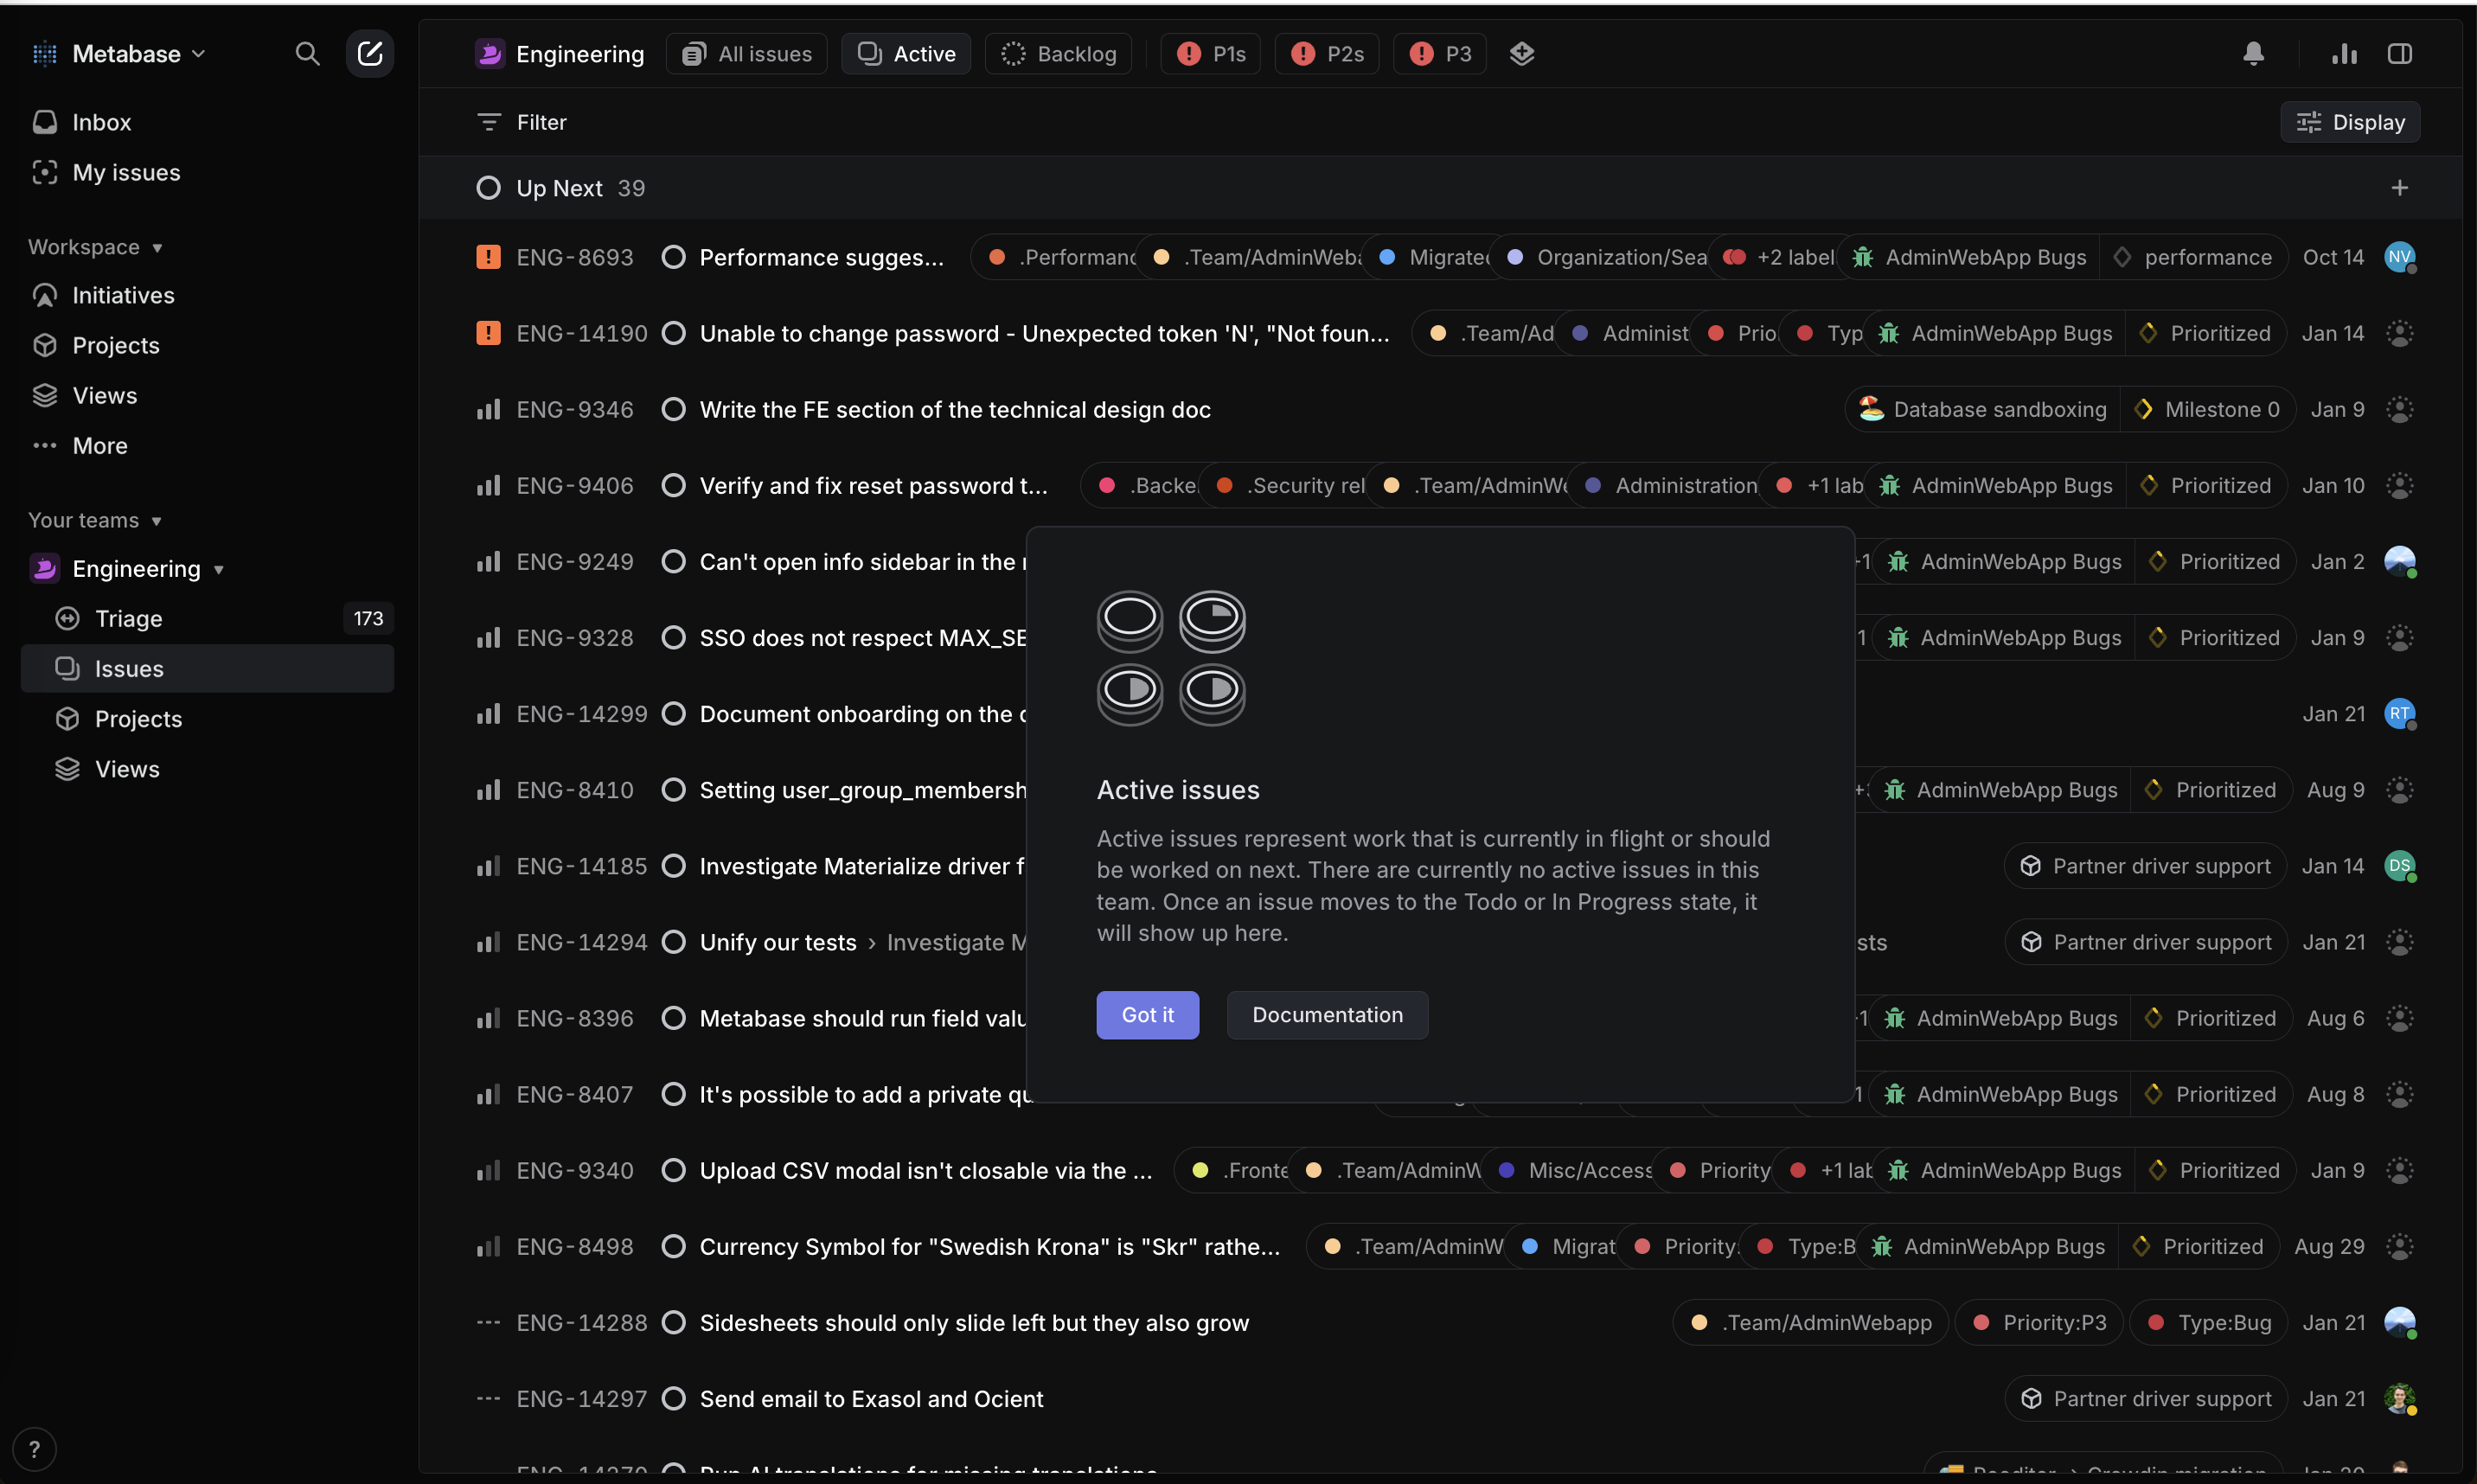
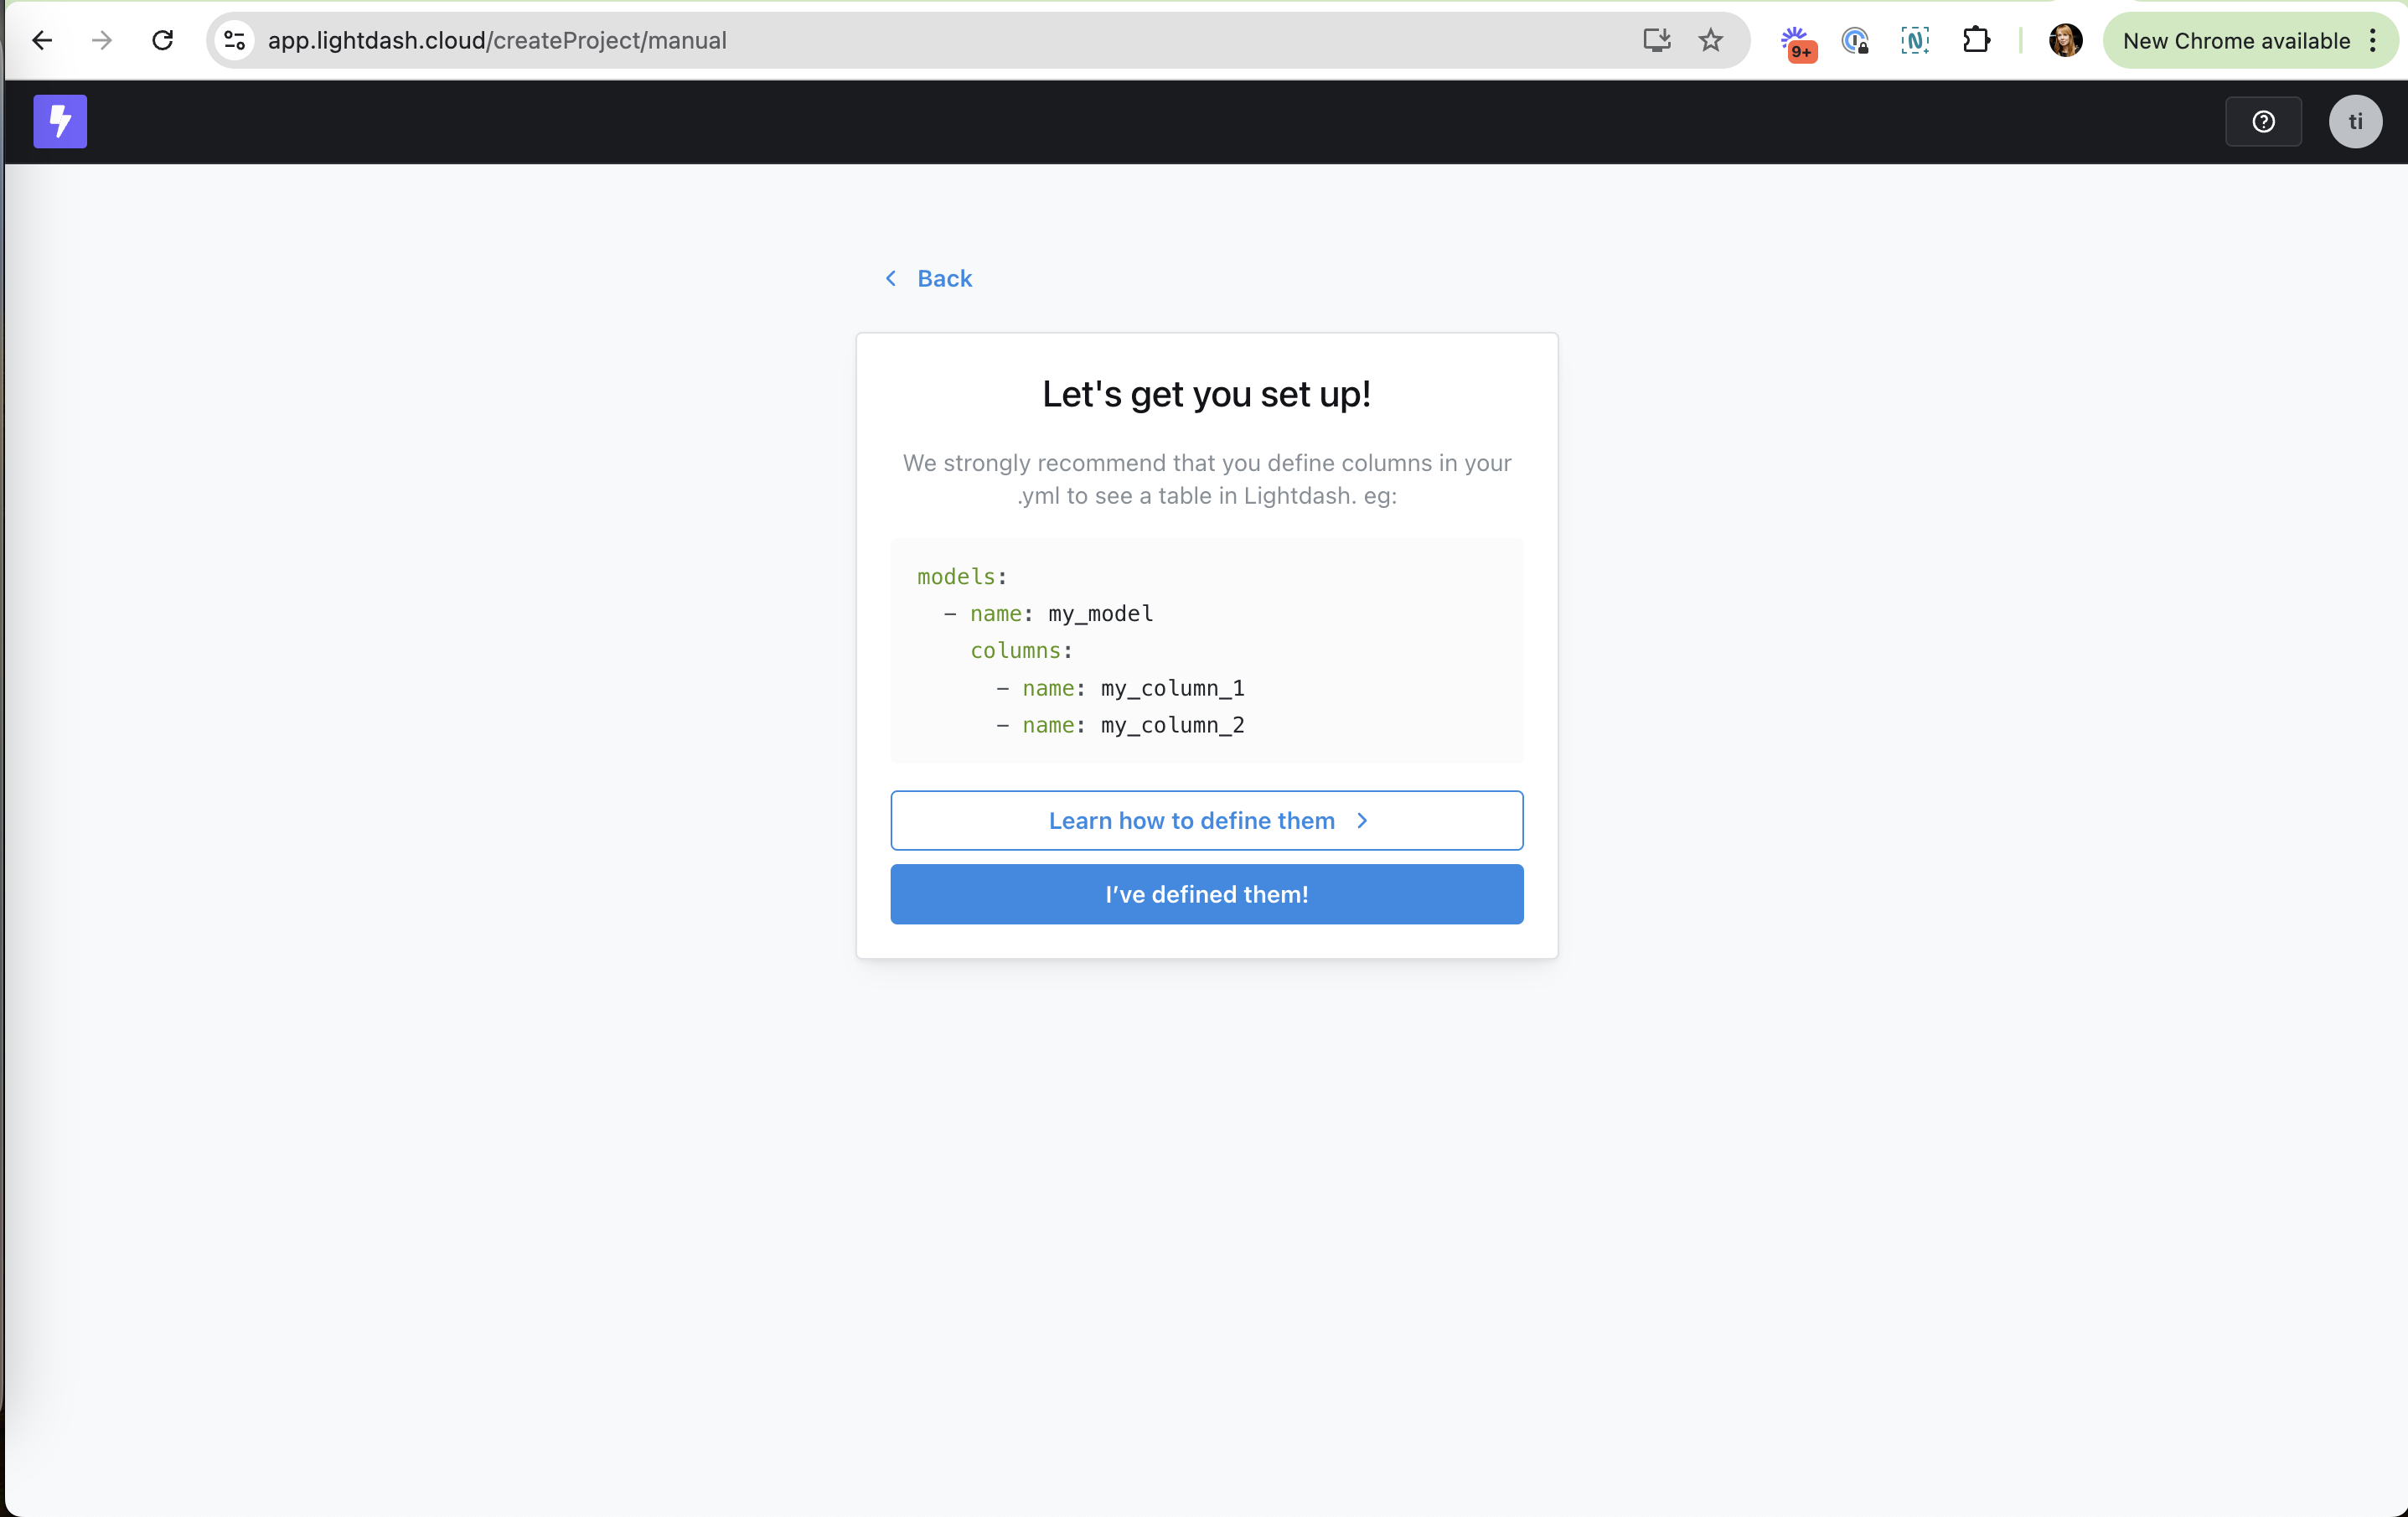
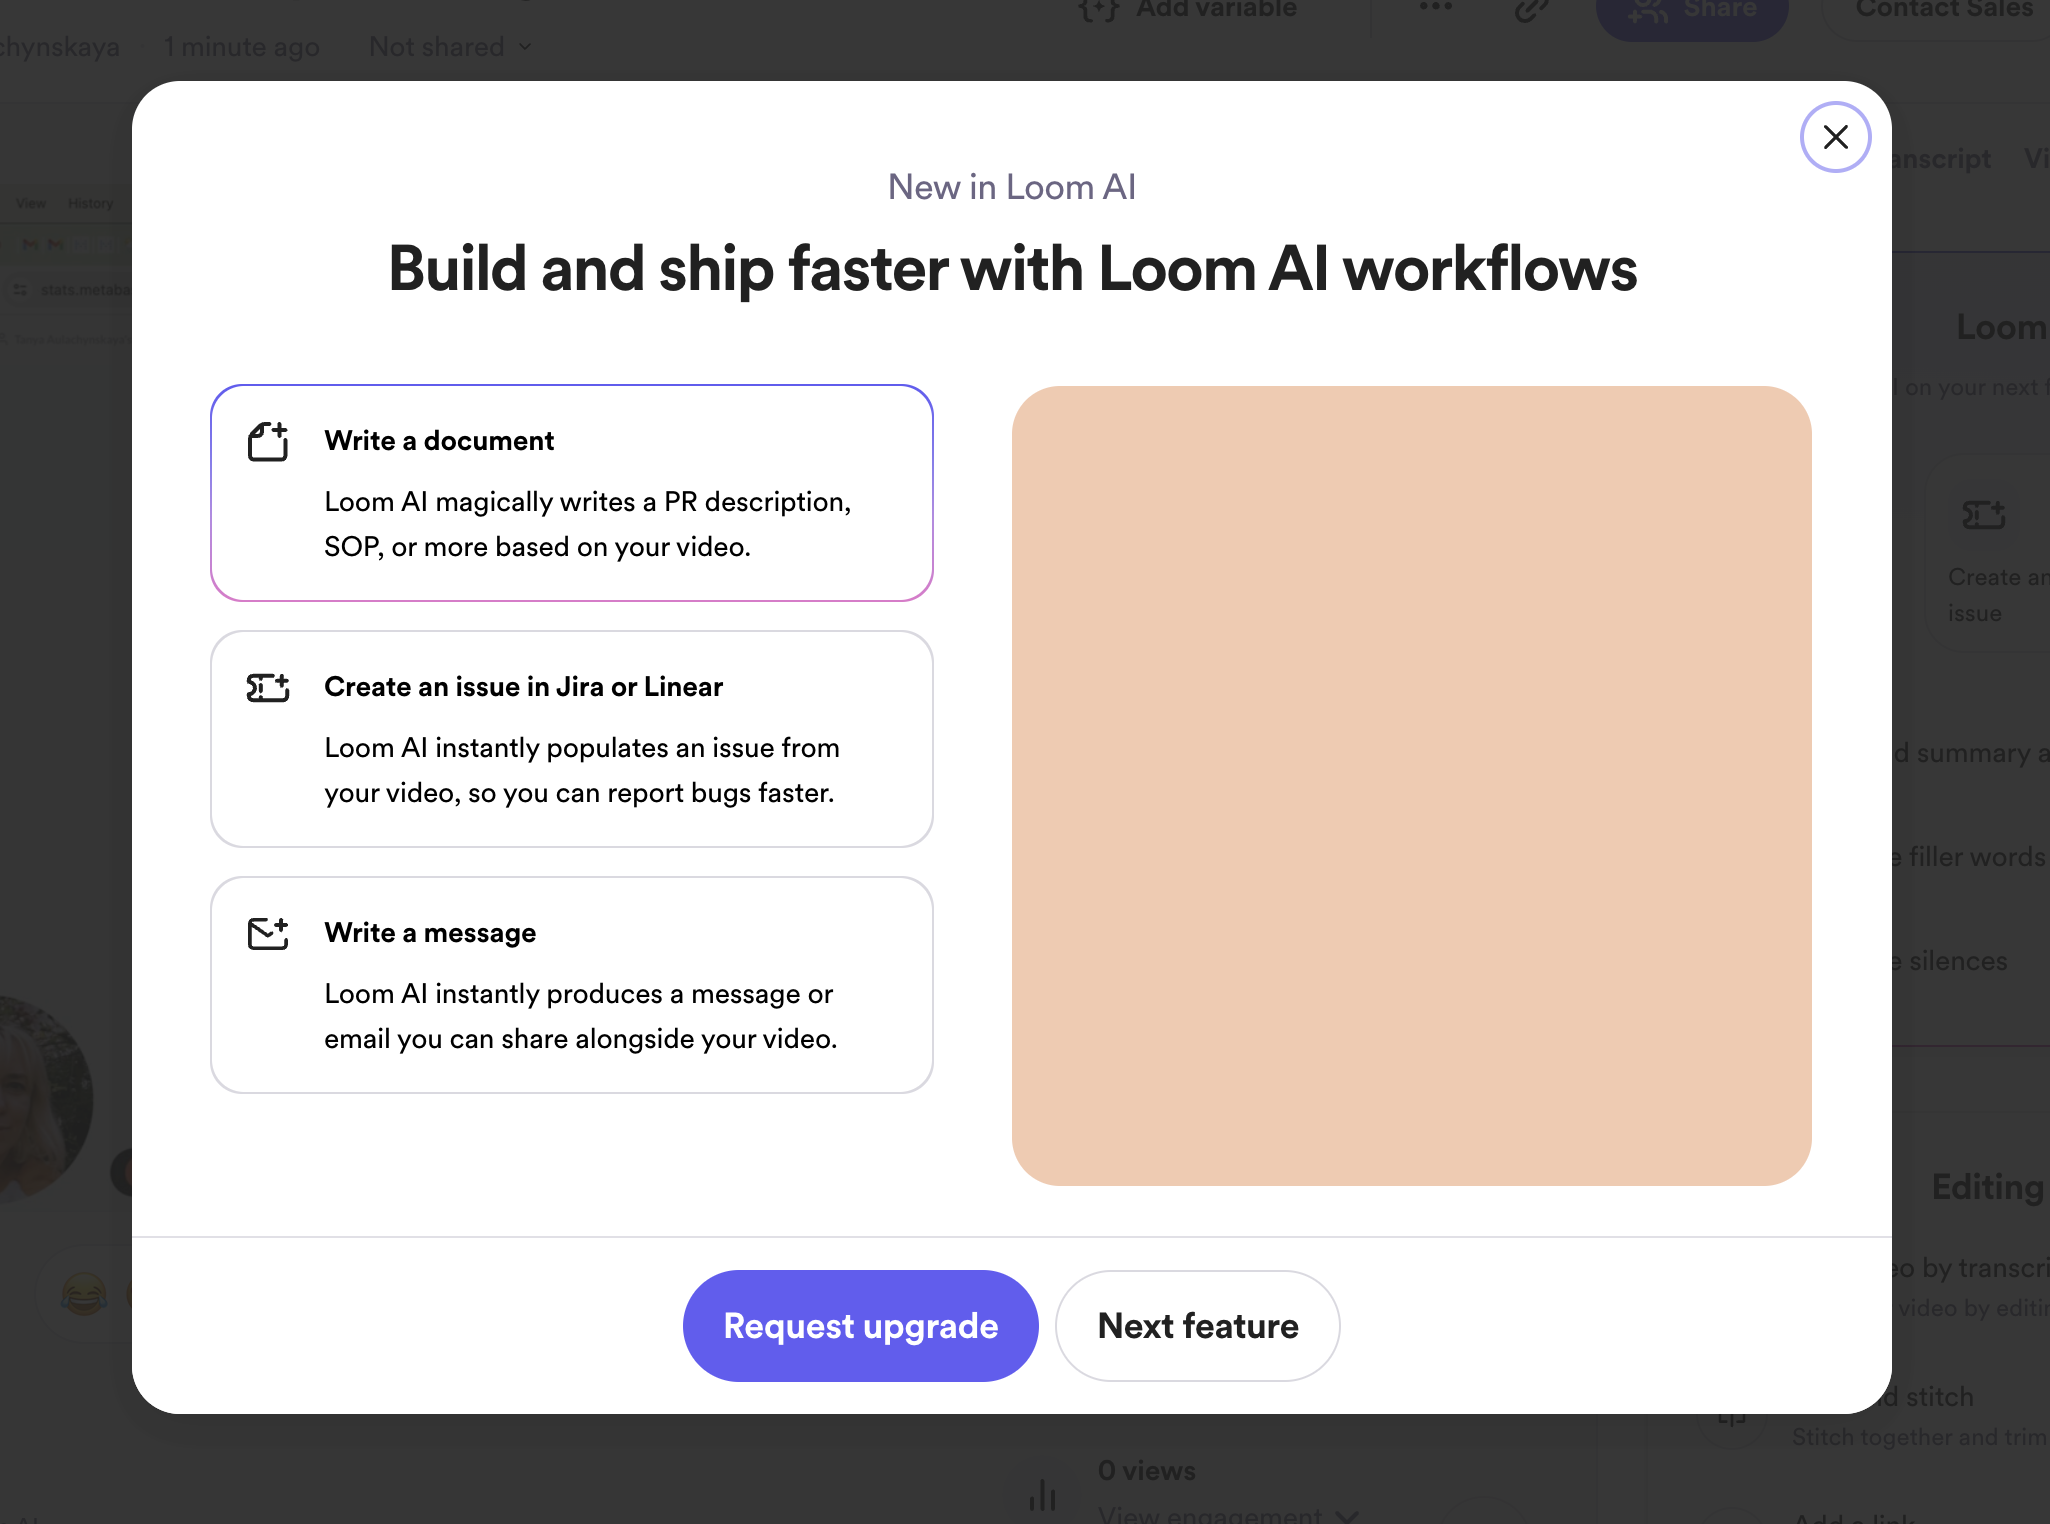
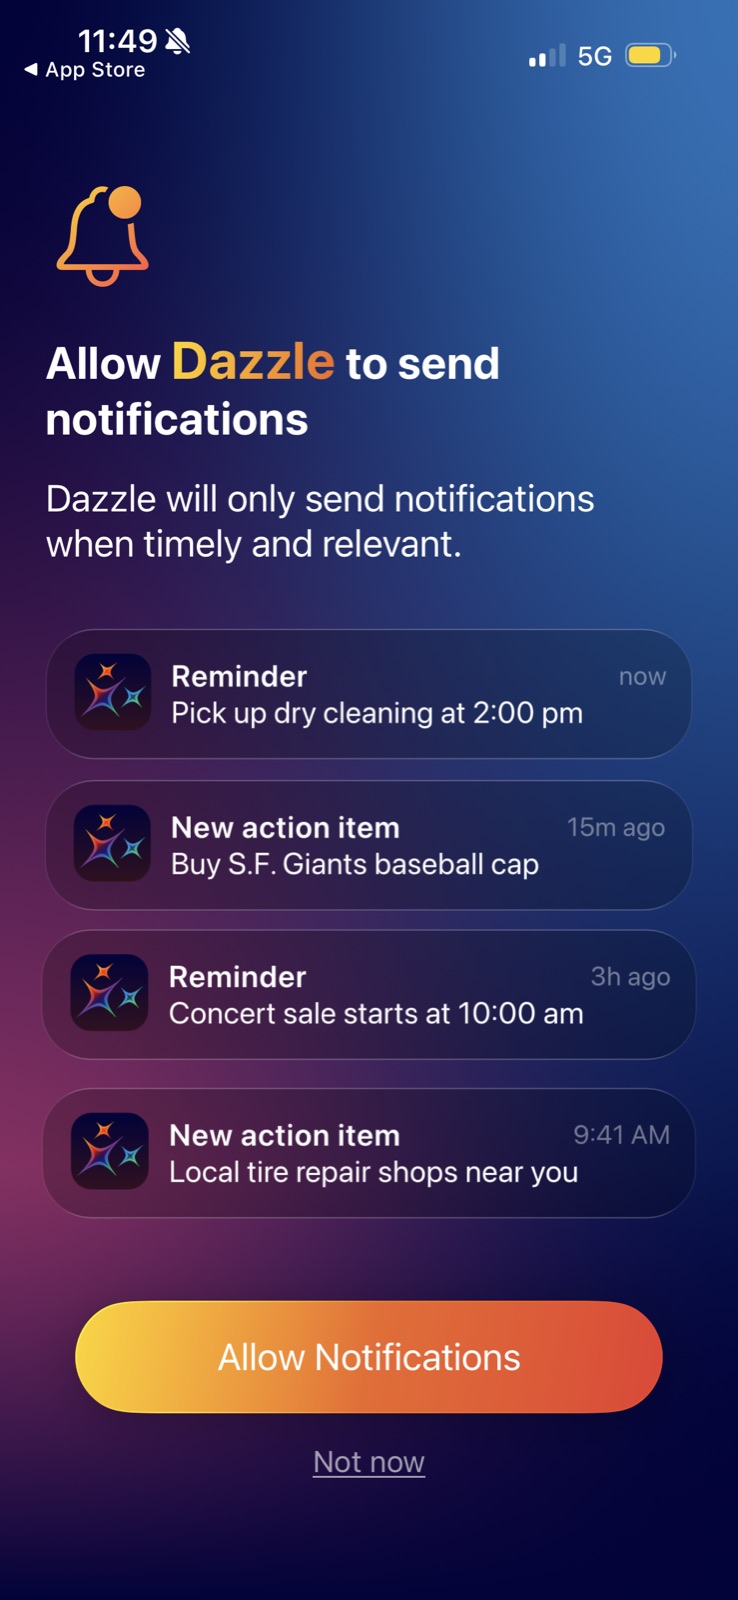
Dazzle AI: Demo instead of features Dazzle AI (working) Demo instead of features A real-looking photo-to-answer exchange shows the product before any explanation. Dazzle AI: Preview of the payoff Dazzle AI (working) Preview of the payoff A reminder card shows what a notification will look like, so the value is concrete. Viktor: One-click example goals Viktor (working) One-click example goals Chips with icons show what good goals look like and fill the box for you. Slack: Live workspace preview Slack (working) Live workspace preview "Your teammate" appears in DMs, so you see the result before you commit. ElevenLabs: Playable voice styles ElevenLabs (working) Playable voice styles Hear Theatrical, Natural and Impersonation instead of reading about them. ElevenLabs: Audio tags in context ElevenLabs (working) Audio tags in context A real script with [yawning] and [groggy] tags teaches syntax by example. Printer app: Use cases as cards Printer app (working) Use cases as cards Documents, Photo and Scanner tiles show what you can print before any copy explains it. Measuring app: Product in the hero Measuring app (working) Product in the hero A room with "4390 cm" and "4210 cm" labels shows the result before the pitch. Cube Cloud: Real prompt in the preview Cube Cloud (working) Real prompt in the preview The screenshot shows a typed question and "See reasoning trace", so the agent's job is visible. Bricks: Shows the result Bricks (working) Shows the result A finished sales dashboard previews what you'll get. Bricks: Examples gallery Bricks (working) Examples gallery "Created in Bricks" shows real outputs to aim for. Bricks: No data, no problem Bricks (working) No data, no problem "Start with AI-generated data and import your own later" keeps people without a file moving. Snowflake: Product preview Snowflake (working) Product preview A dashboard with collaborator tags ("Janice", "Jade") shows what you're about to use. Julius: Example output Julius (working) Example output A real chart ("Distribution of Squirrel Fur Colors") shows what you'll get before you upload anything. Julius: Real result preview Julius (working) Real result preview A boxplot with t-statistic and p-value shows the level of output to expect. Julius: Decomposition preview Julius (working) Decomposition preview Observed, trend, seasonal and residual panels preview the output. Julius: Output as thumbnail Julius (working) Output as thumbnail Each card shows the chart it makes, so you browse by result. Linear: Try it now Linear (working) Try it now Big keycaps invite you to press the shortcut, so you learn by doing. Linear: Visual for the concept Linear (working) Visual for the concept Status icons and a title show what "Active issues" means at a glance. Lightdash: Shows the exact YAML Lightdash (working) Shows the exact YAML A copyable example of models and columns instead of a paragraph of docs. Tinybird: Sample charts behind Tinybird (working) Sample charts behind Line and bar charts show what you'll get before you build anything. Tinybird: Preview of the data Tinybird (working) Preview of the data The first rows appear under the guessed column and type. Count: Examples to copy Count (working) Examples to copy "See it to believe it." leads into finished example canvases. Holistics: Skeleton of the IDE Holistics (working) Skeleton of the IDE A greyed preview of the workspace shows what you're about to unlock. Holistics: Preview of the result Holistics (working) Preview of the result The right panel shows the model file and fields you'll get. Holistics: Relationship diagram Holistics (working) Relationship diagram Linked model cards with 1-to-n lines show what a dataset does. Google One: Usage as a bar Google One (working) Usage as a bar "72.19 GB used" of "100 GB" is readable at a glance. Slack: Half the modal is a skeleton Slack (not working) Half the modal is a skeleton The right side is a generic placeholder, a missed chance to show what Business+ looks like. OpenAI API: Next tier, no payoff OpenAI API (not working) Next tier, no payoff "Usage tier 2" is named but its higher limits aren't shown here. Julius: Illustration, not output Julius (not working) Illustration, not output Unlike Quick Visualization, the preview is a generic folders graphic, so you can't see a result. Amplitude: Text-only cards Amplitude (not working) Text-only cards No preview of the charts each dataset unlocks, so the choice is a guess. ActiveCampaign: Big logo, no detail ActiveCampaign (not working) Big logo, no detail The right half is a logo; how long it takes or what gets moved would answer the next question. Loom: Empty media area Loom (not working) Empty media area Half the modal is a blank peach box where a preview should be.