Usability heuristic

Visibility of system status

Keep users informed about what the system is doing and what their actions caused, through timely, clear feedback.

Visibility of system status The same file import shown two ways. One is an endless spinner that leaves the user wondering if the app froze. The other says 3 of 5 files, shows a progress bar and the time left. Below, Nielsen's limits: 0.1 second feels instant, 1 second keeps the flow, past 10 seconds people need to see progress. Is it working or stuck? Importing… “Did it freeze? Do I start over?” No sign of how far along it is You can see where it stands Importing 3 of 5 files 60% About 20 seconds left Ends with “5 files imported” How long people will wait (Nielsen) 0.1 s feels instant 1 s keeps the flow 10 s+ show progress
A bare spinner leaves people guessing, while a progress bar with a count and time left shows where things stand; Nielsen's limits say waits past 10 seconds need progress.

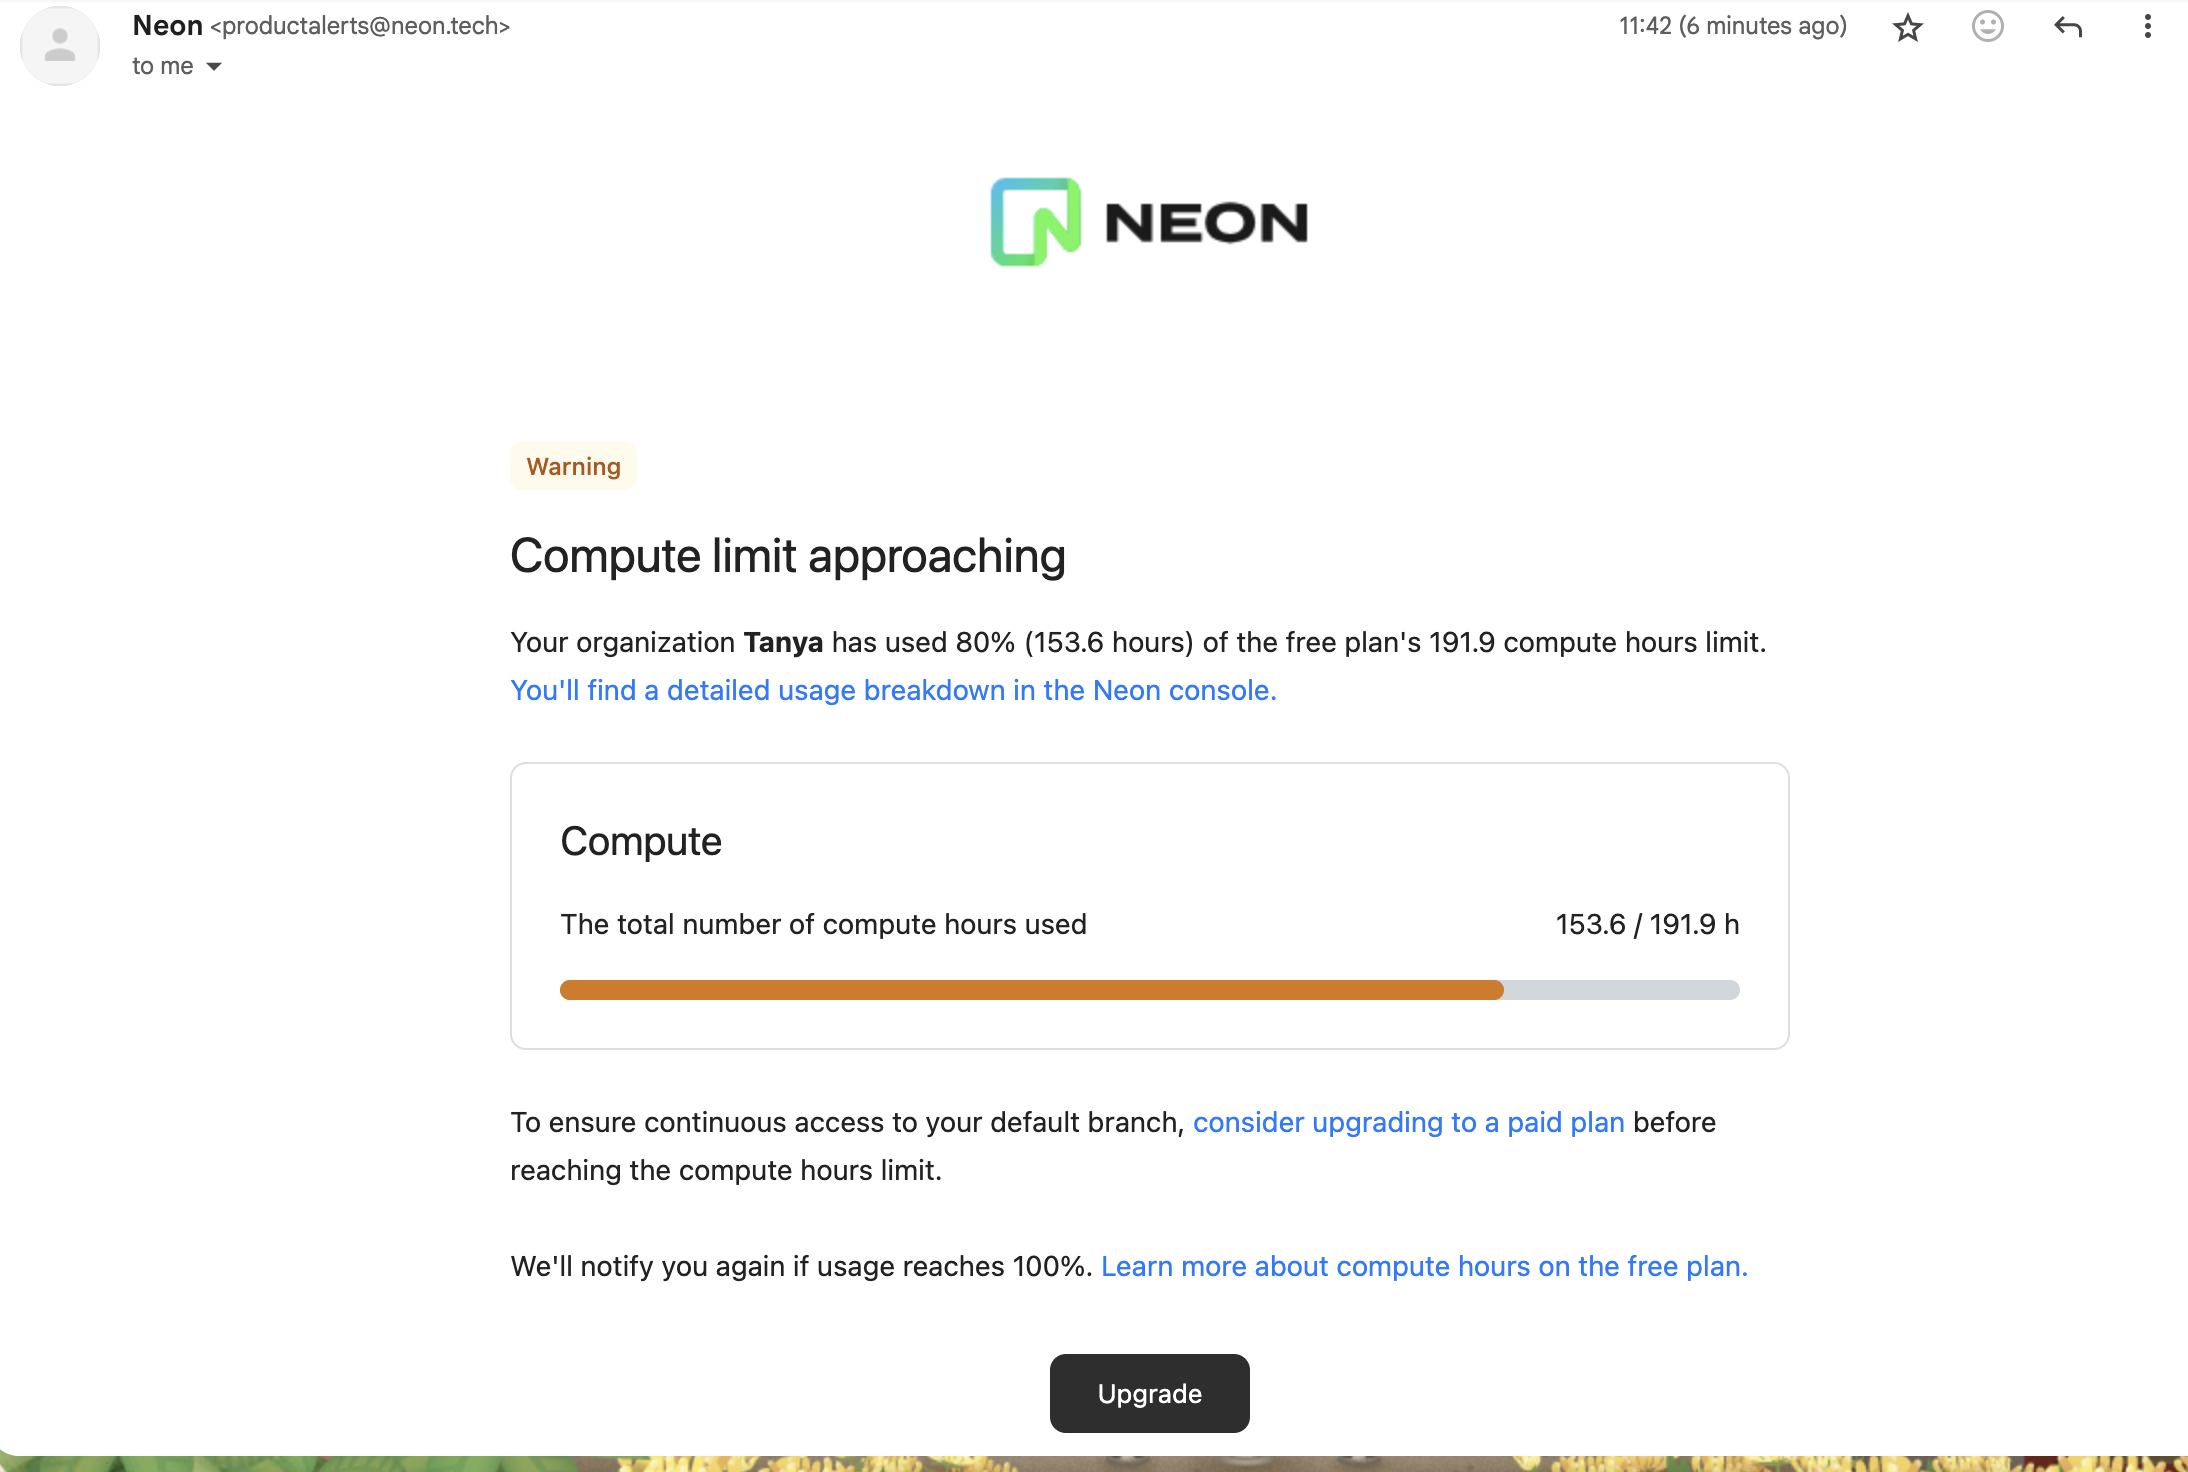
This is Nielsen's first usability heuristic: people should always be able to tell what state the product is in and what just happened after they acted. On this site it covers loading and progress feedback, confirmation that setup worked, usage meters, and changes over time shown on metrics.

Nielsen's response-time limits give the timing: under 0.1 second feels instant, up to 1 second keeps the user's flow, and beyond about 10 seconds people lose focus unless they see progress. Brad Myers's 1985 CHI study concluded that percent-done progress indicators make programs more attractive and effective to use. Nielsen Norman Group's article on the heuristic ties clear status to user control and trust.

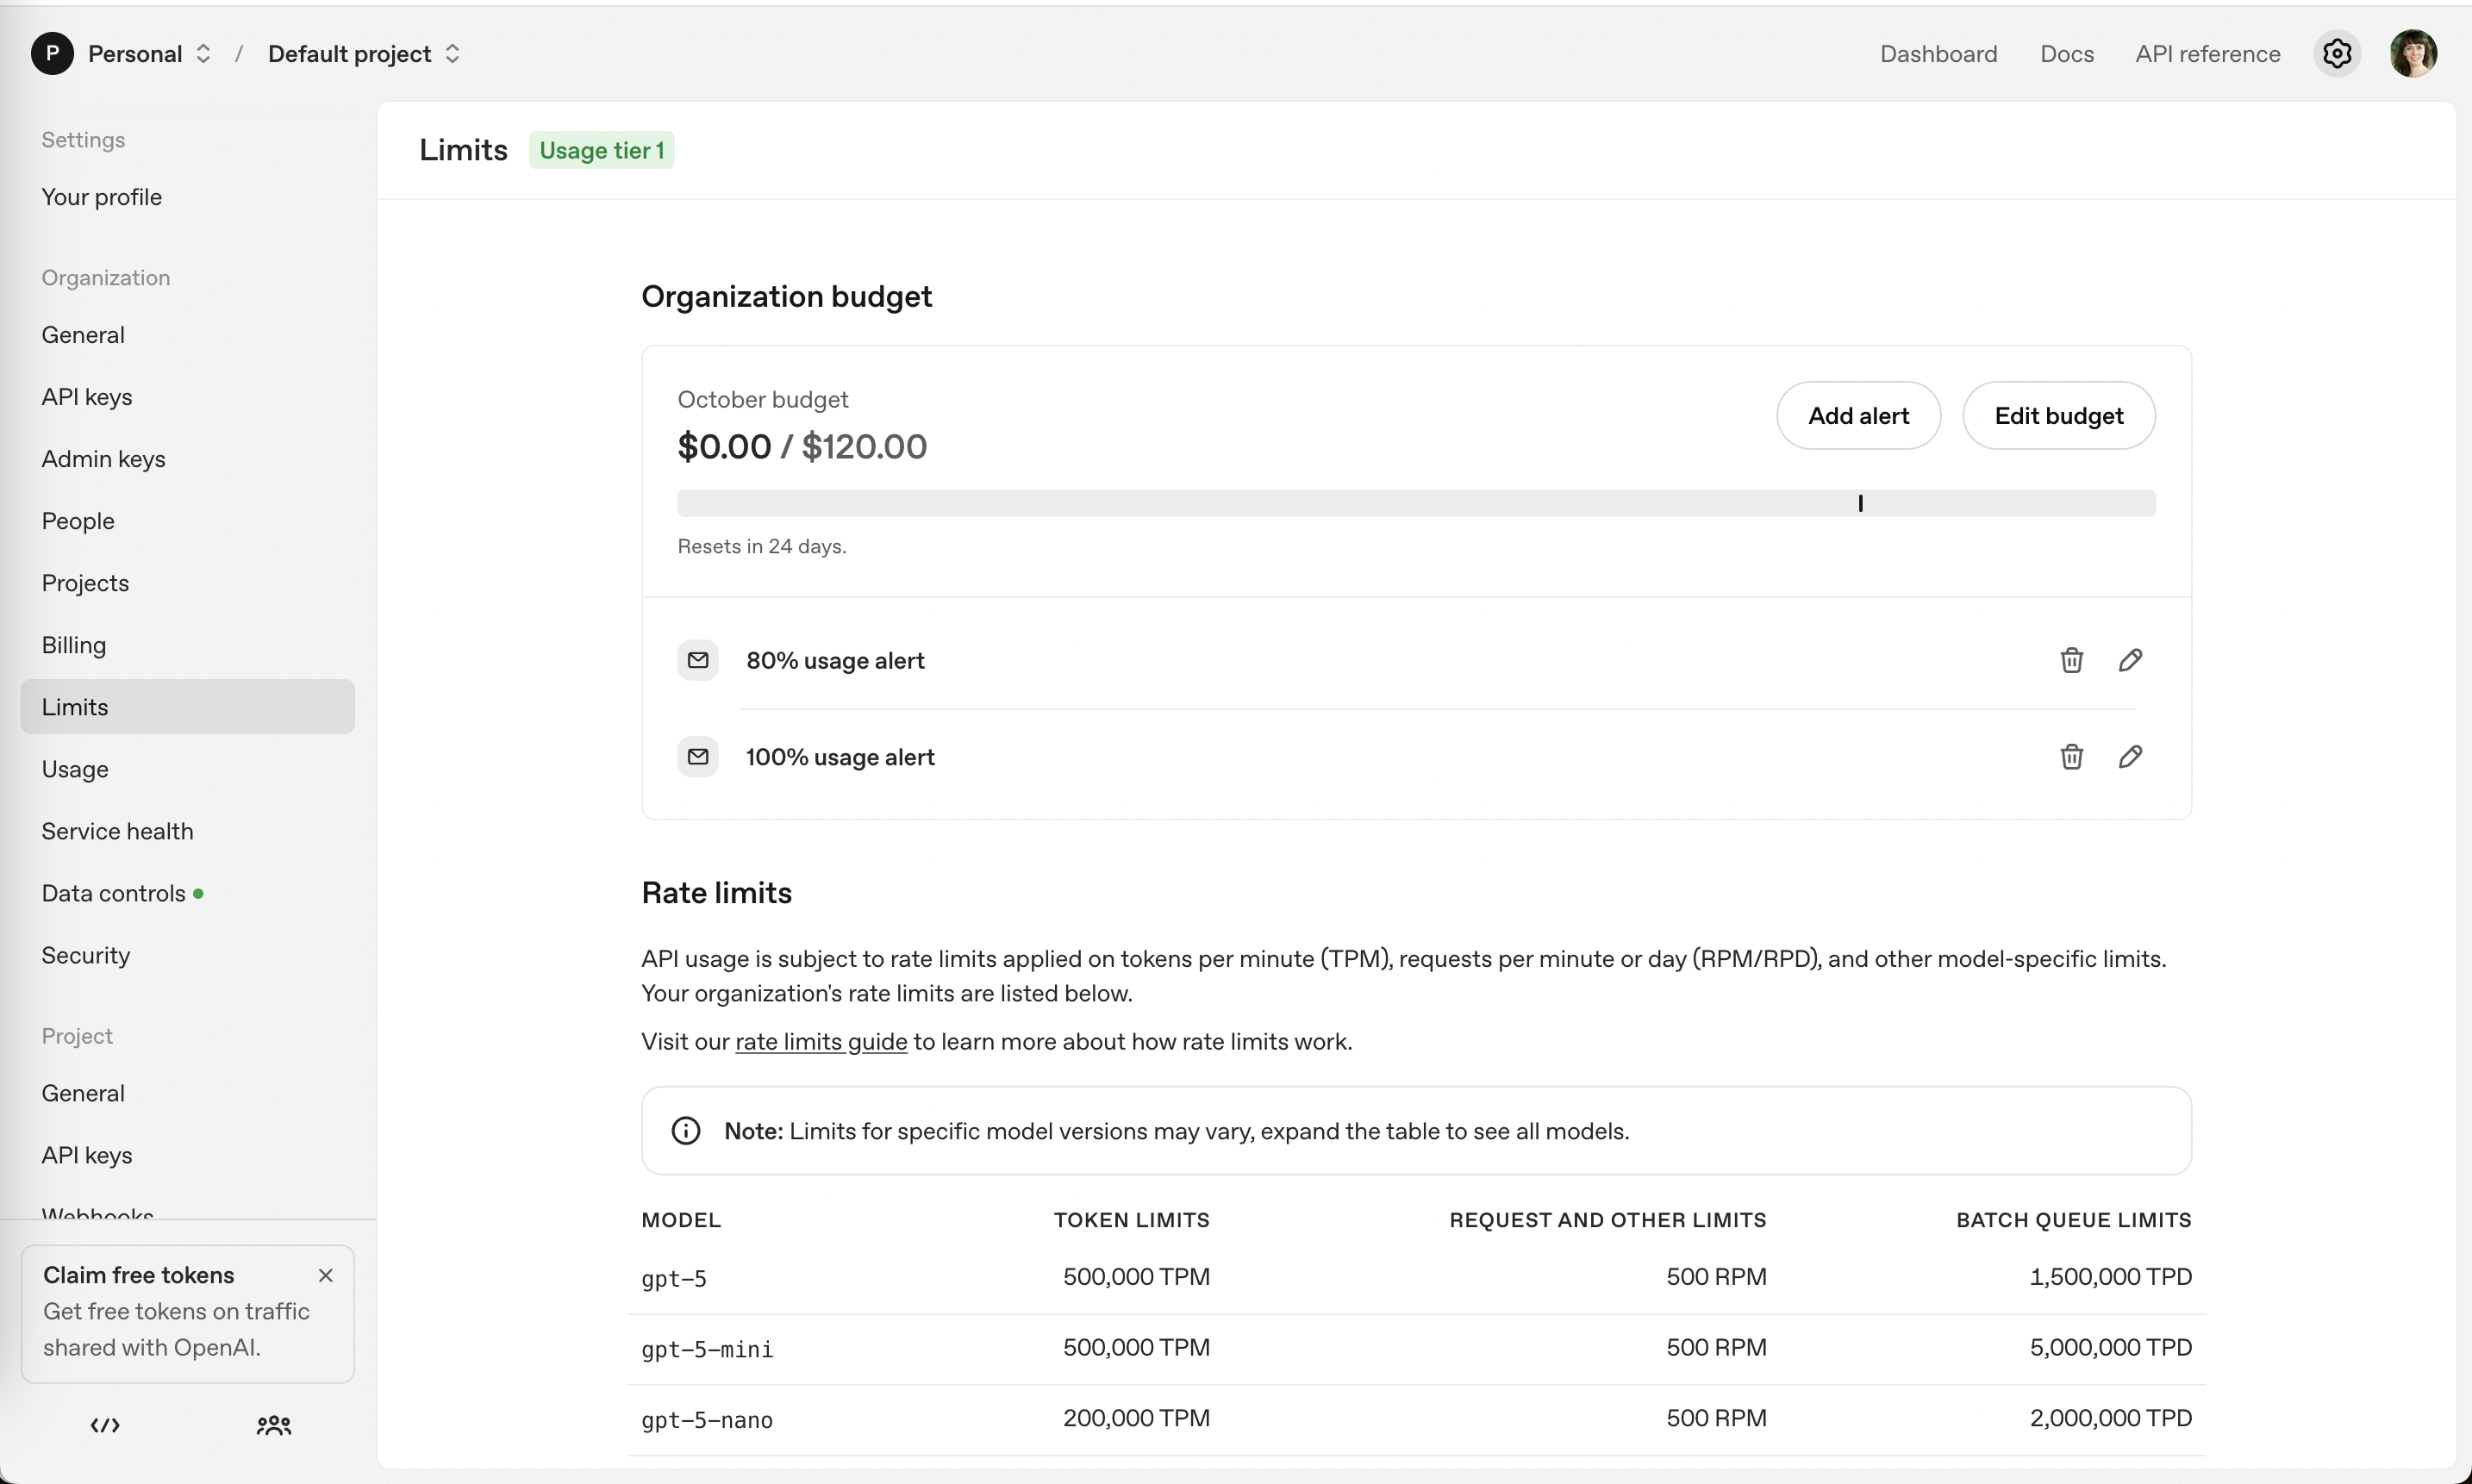
In onboarding, status feedback confirms that a connection, import or deployment actually worked before asking for the next step. In billing and upsells it means showing usage against the limit ("$0 / $120 this month", "14 of 20 left") and turning the pay button into a progress state so nobody double-charges.

How to use it

  • Show a progress state on any button that starts a slow or payment action, and disable it while it runs.
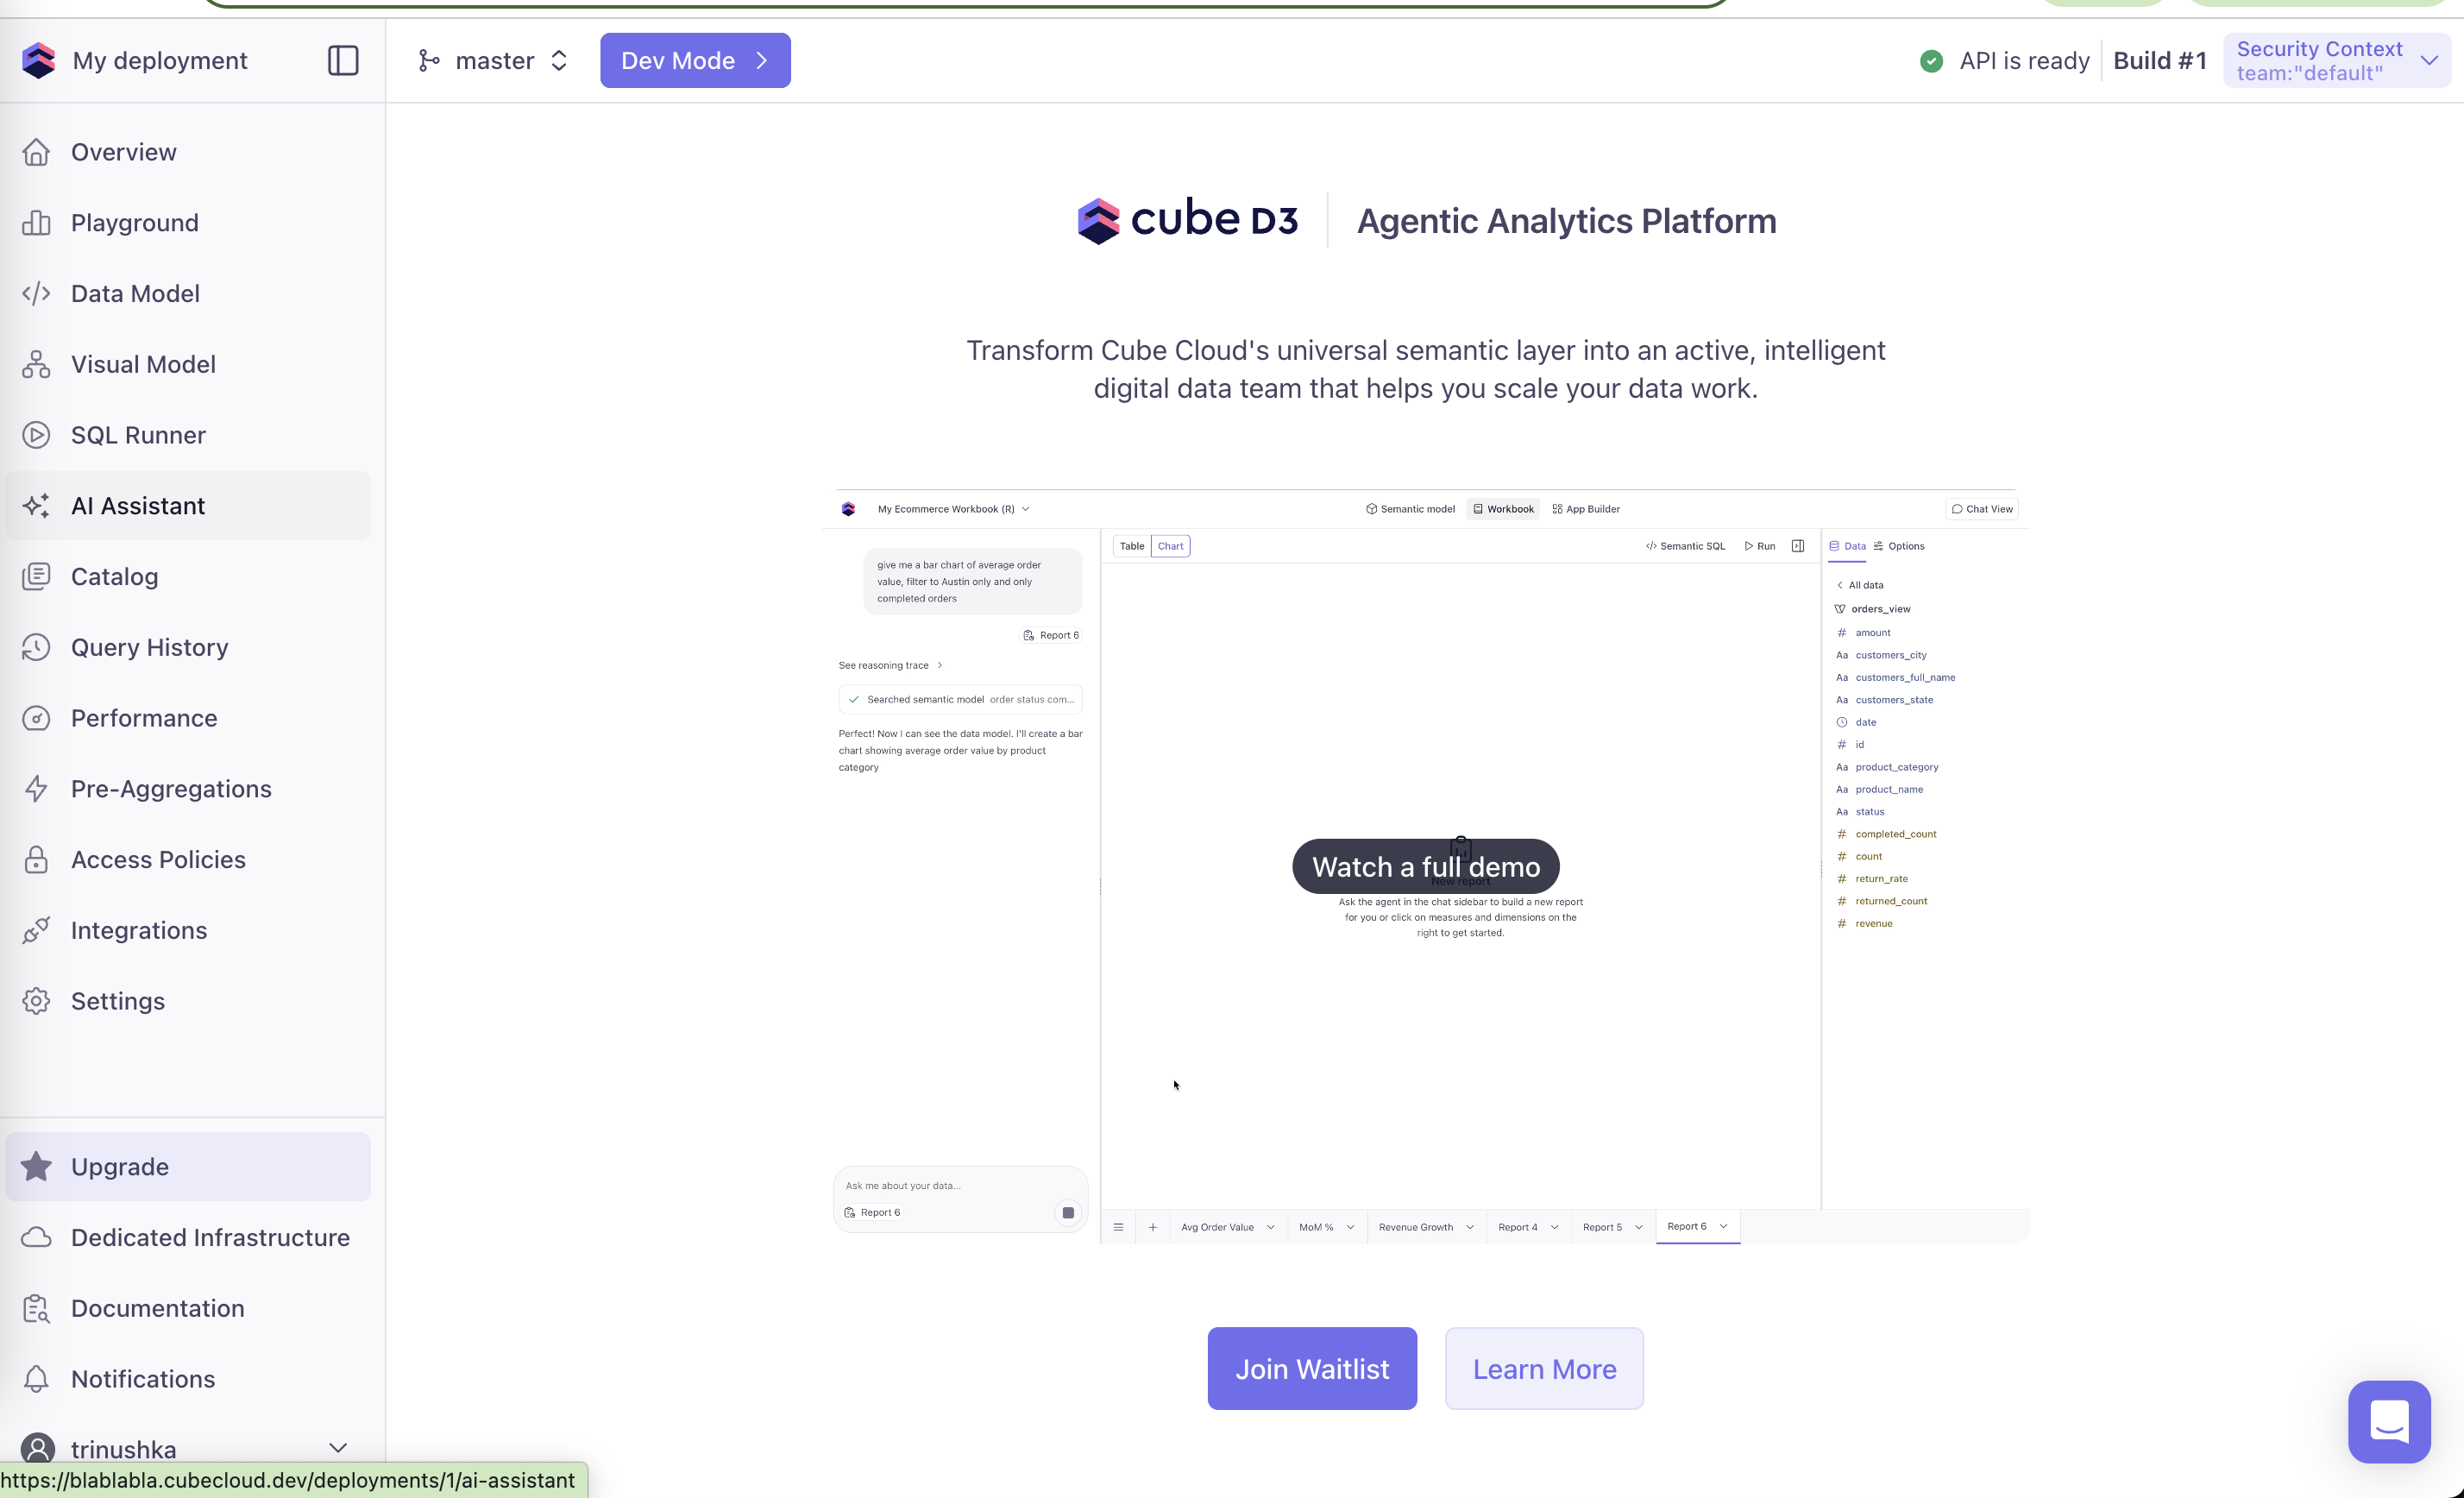
  • After setup steps, confirm success with a specific message ("API is ready", "3 files imported").
  • Display usage as used vs limit with the period, near where users decide whether to upgrade.

Watch out

  • Spinners with no end for long jobs; past about 10 seconds show progress or an estimate.
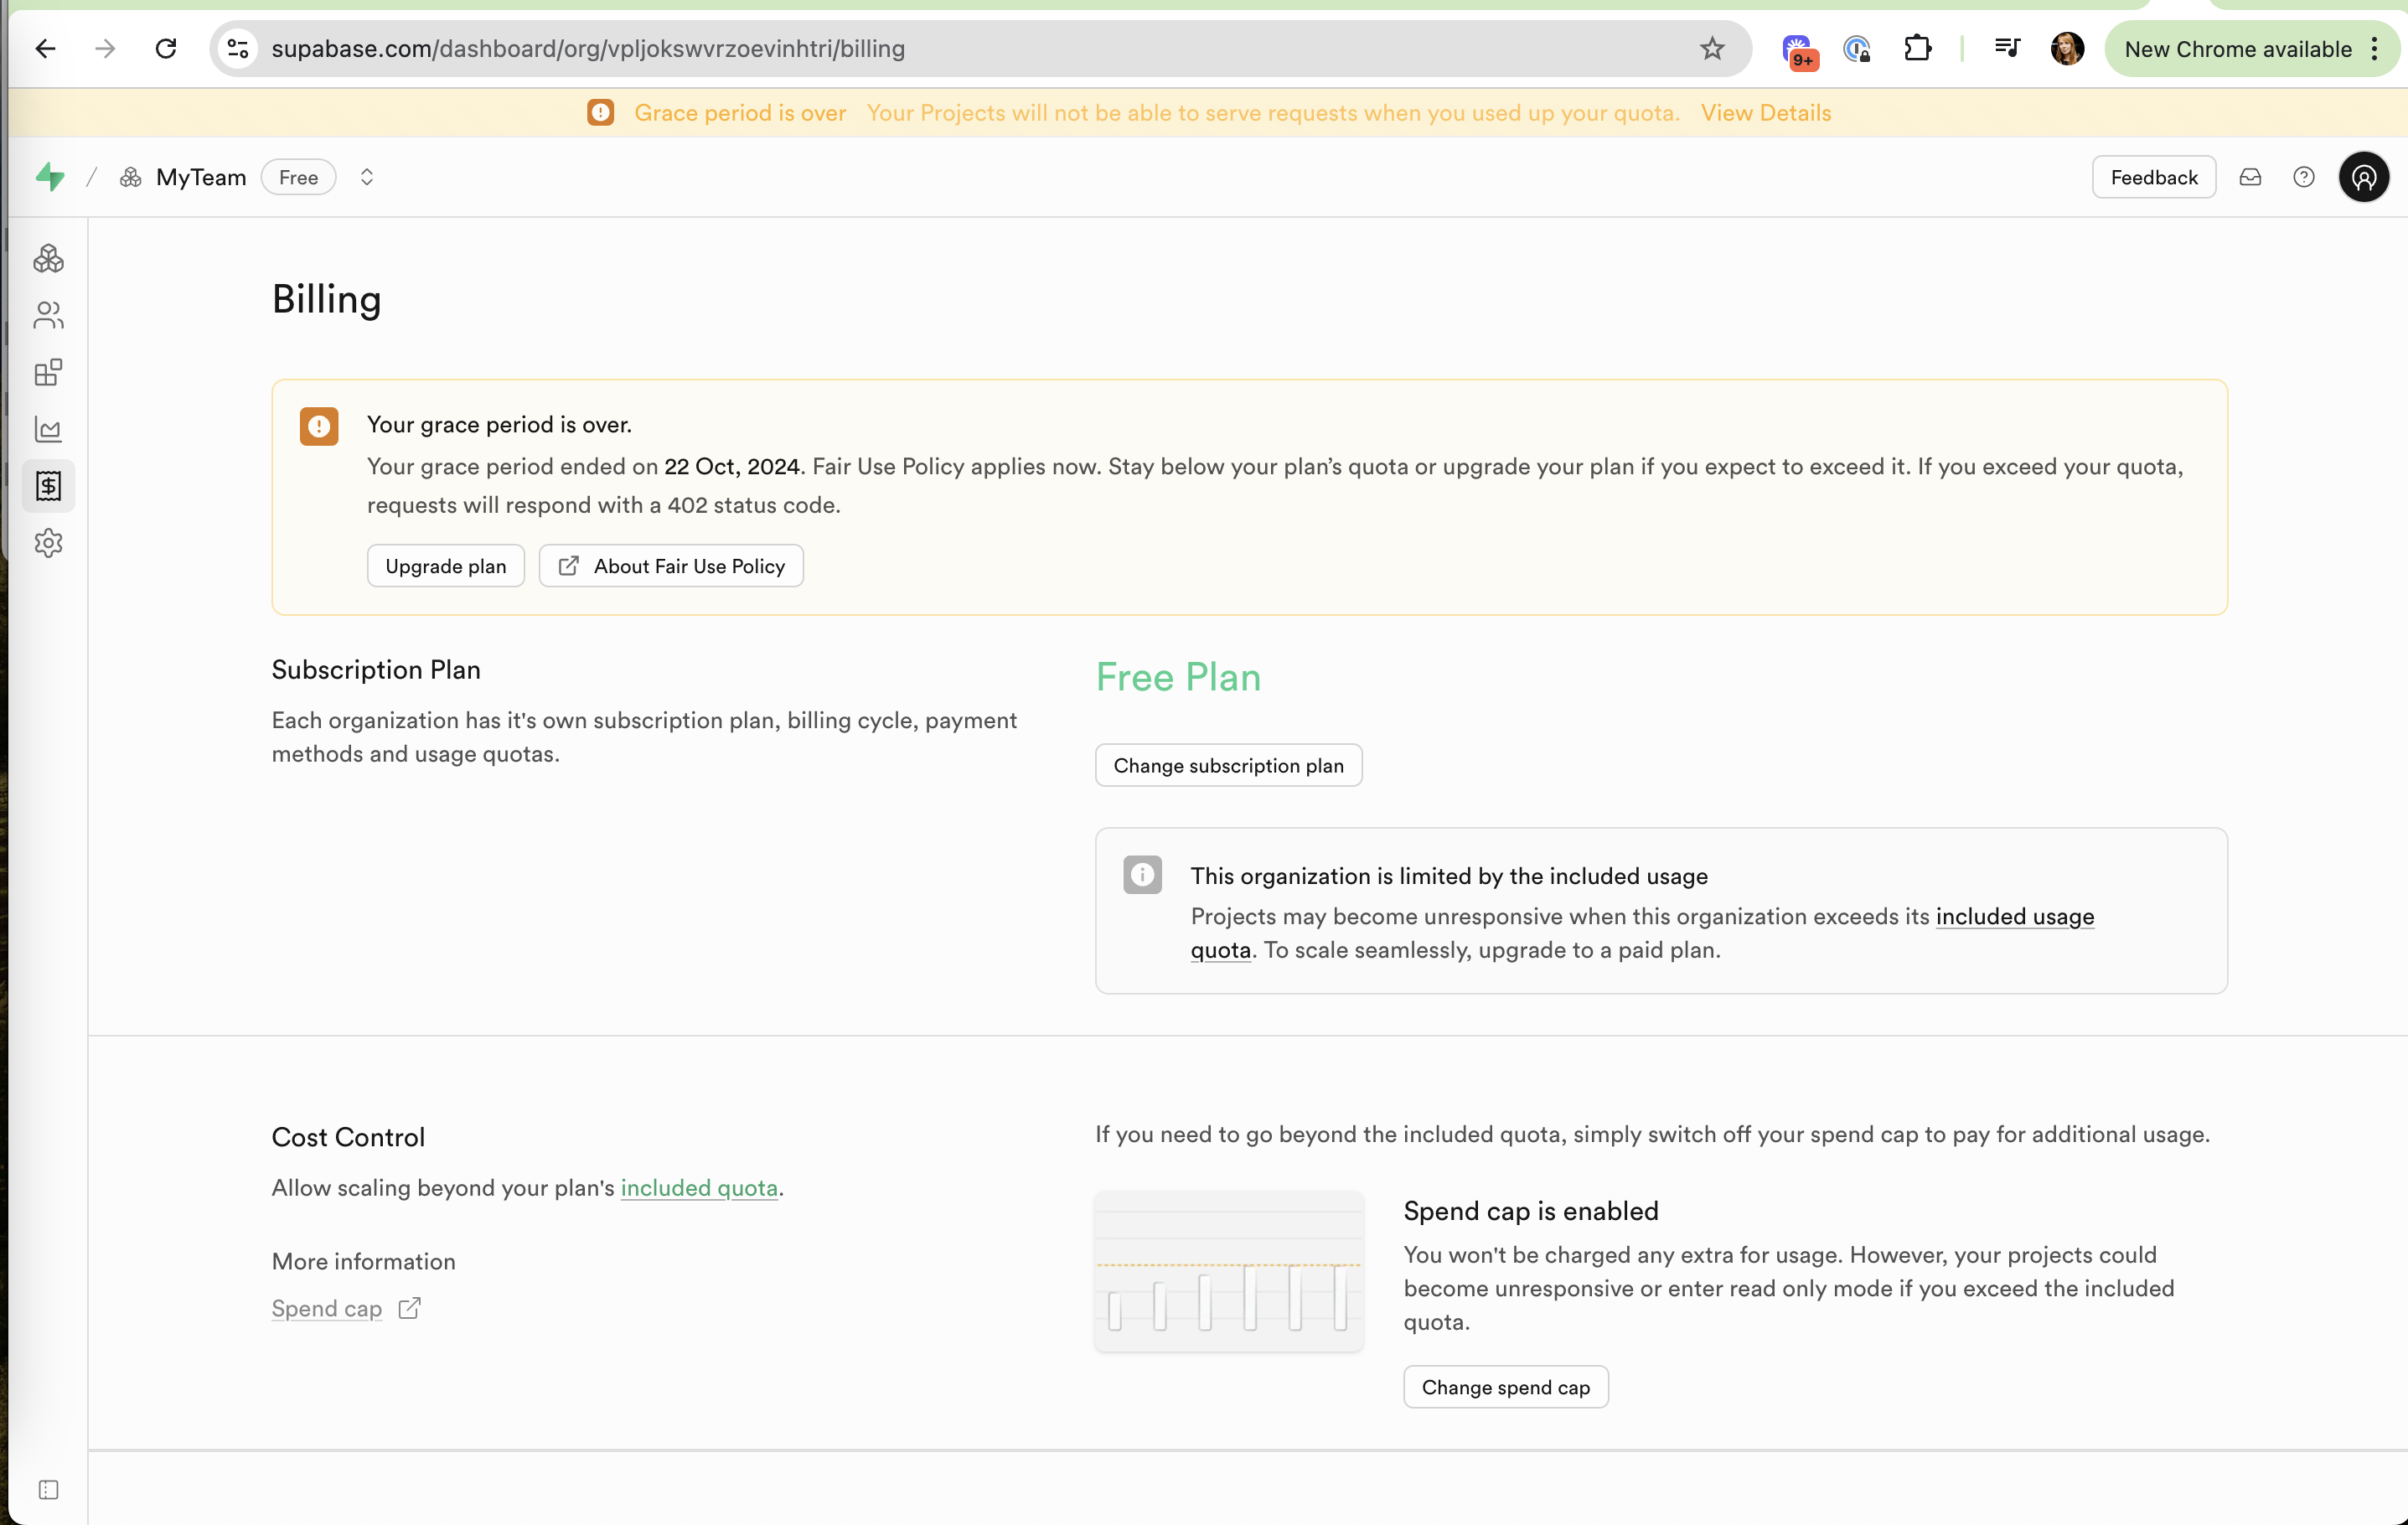
  • Status that is technically present but hidden or ambiguous, like a tiny icon change after a payment.
Related

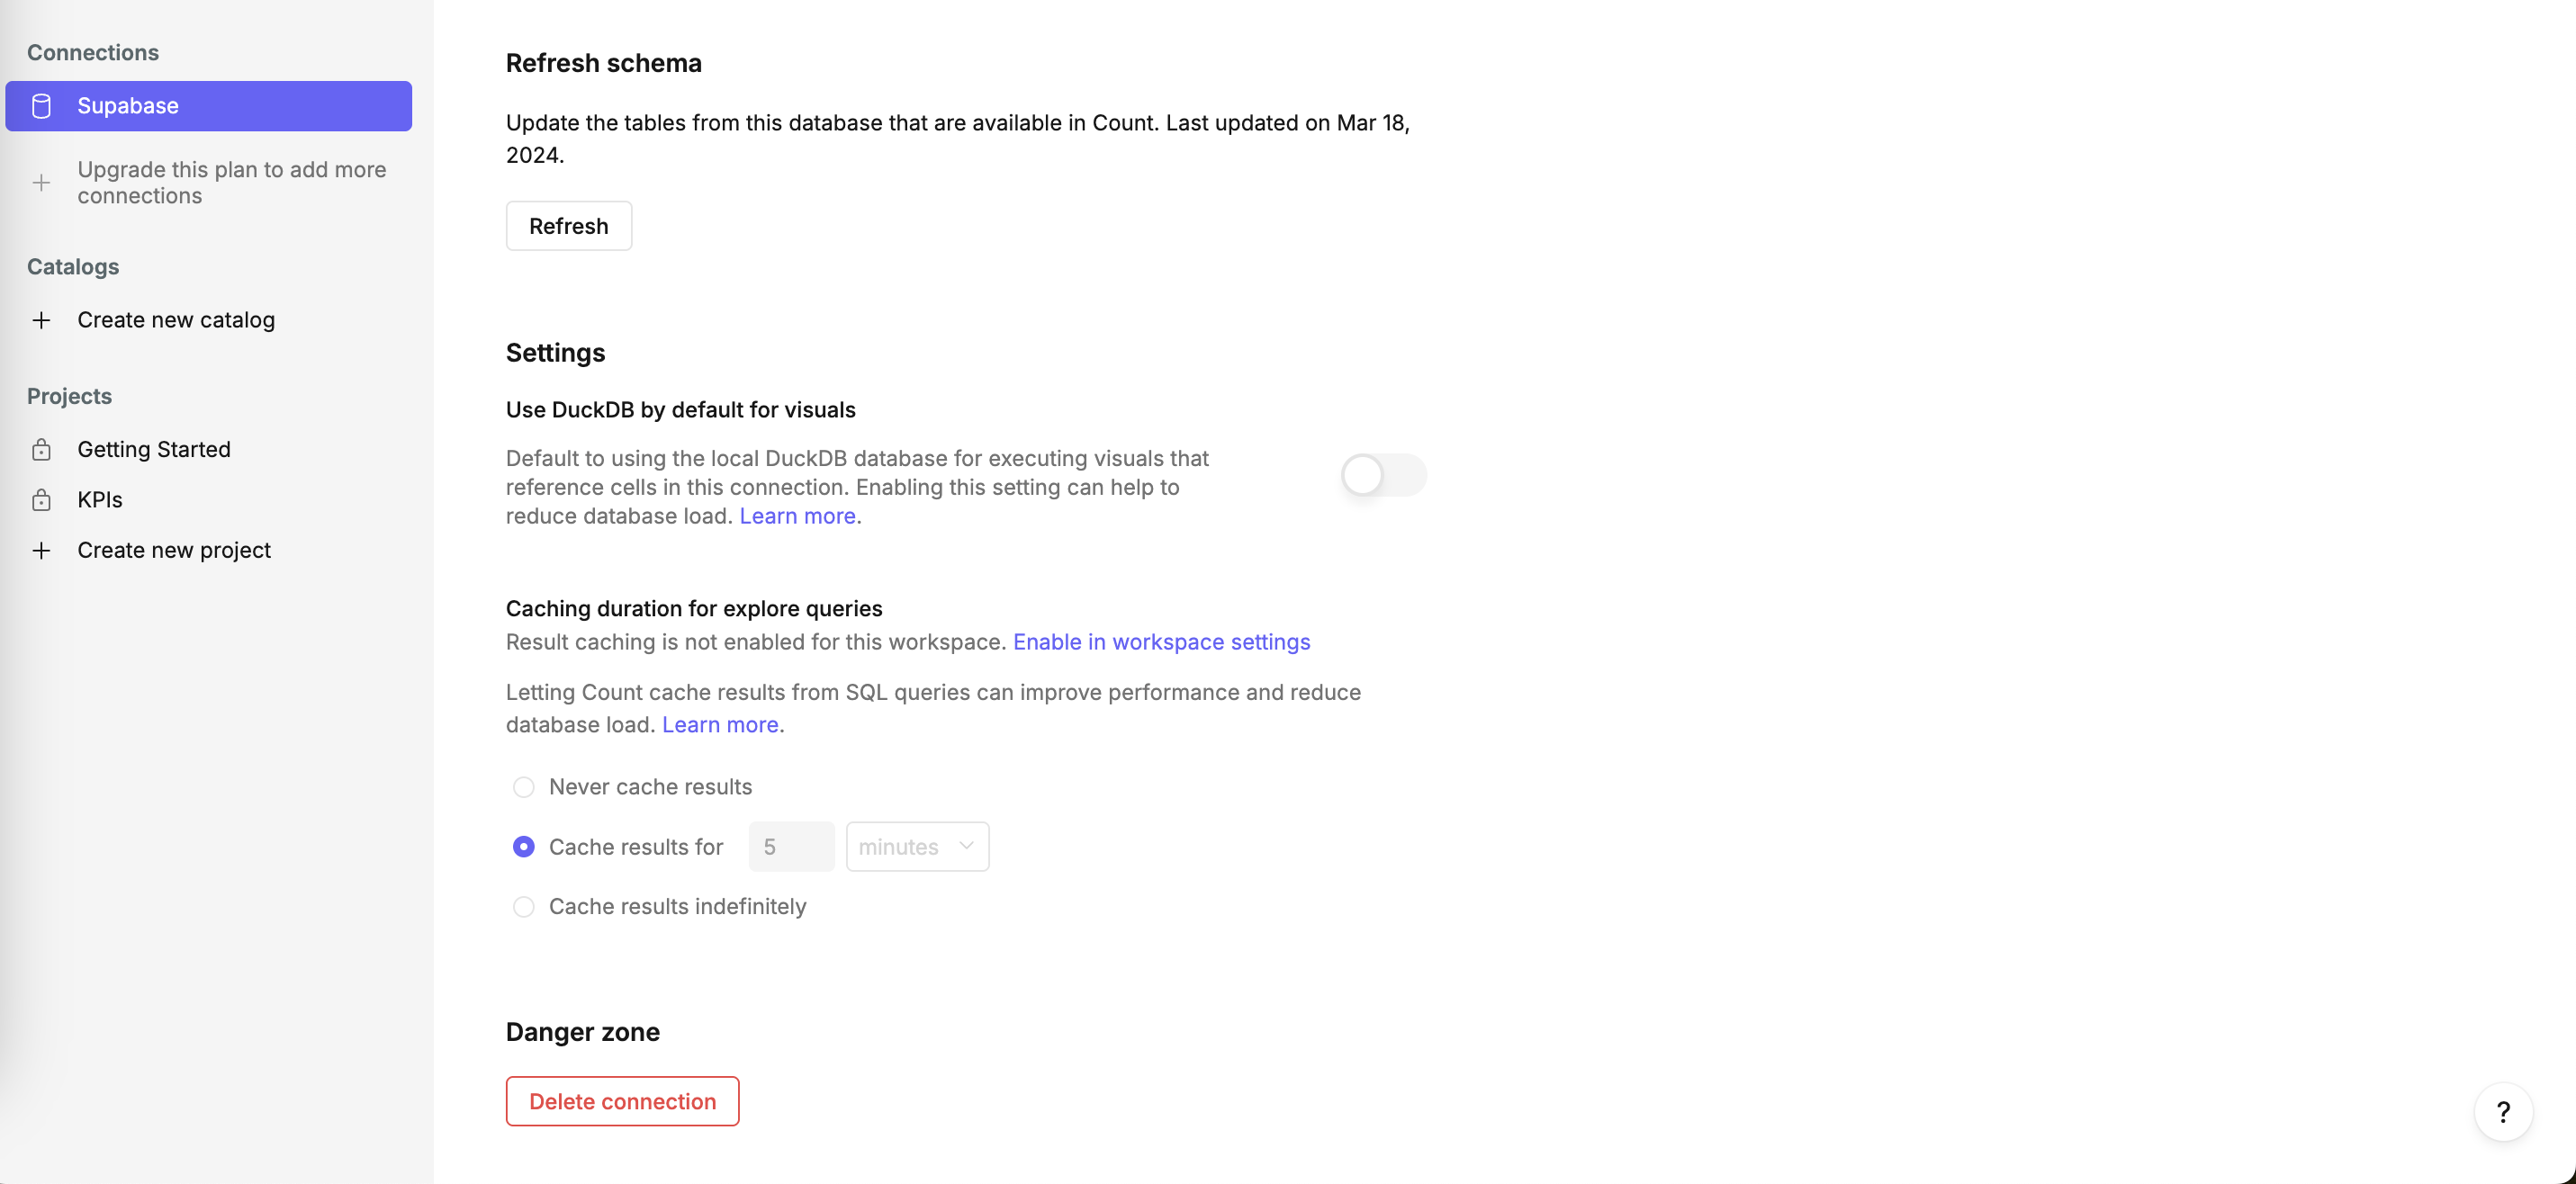
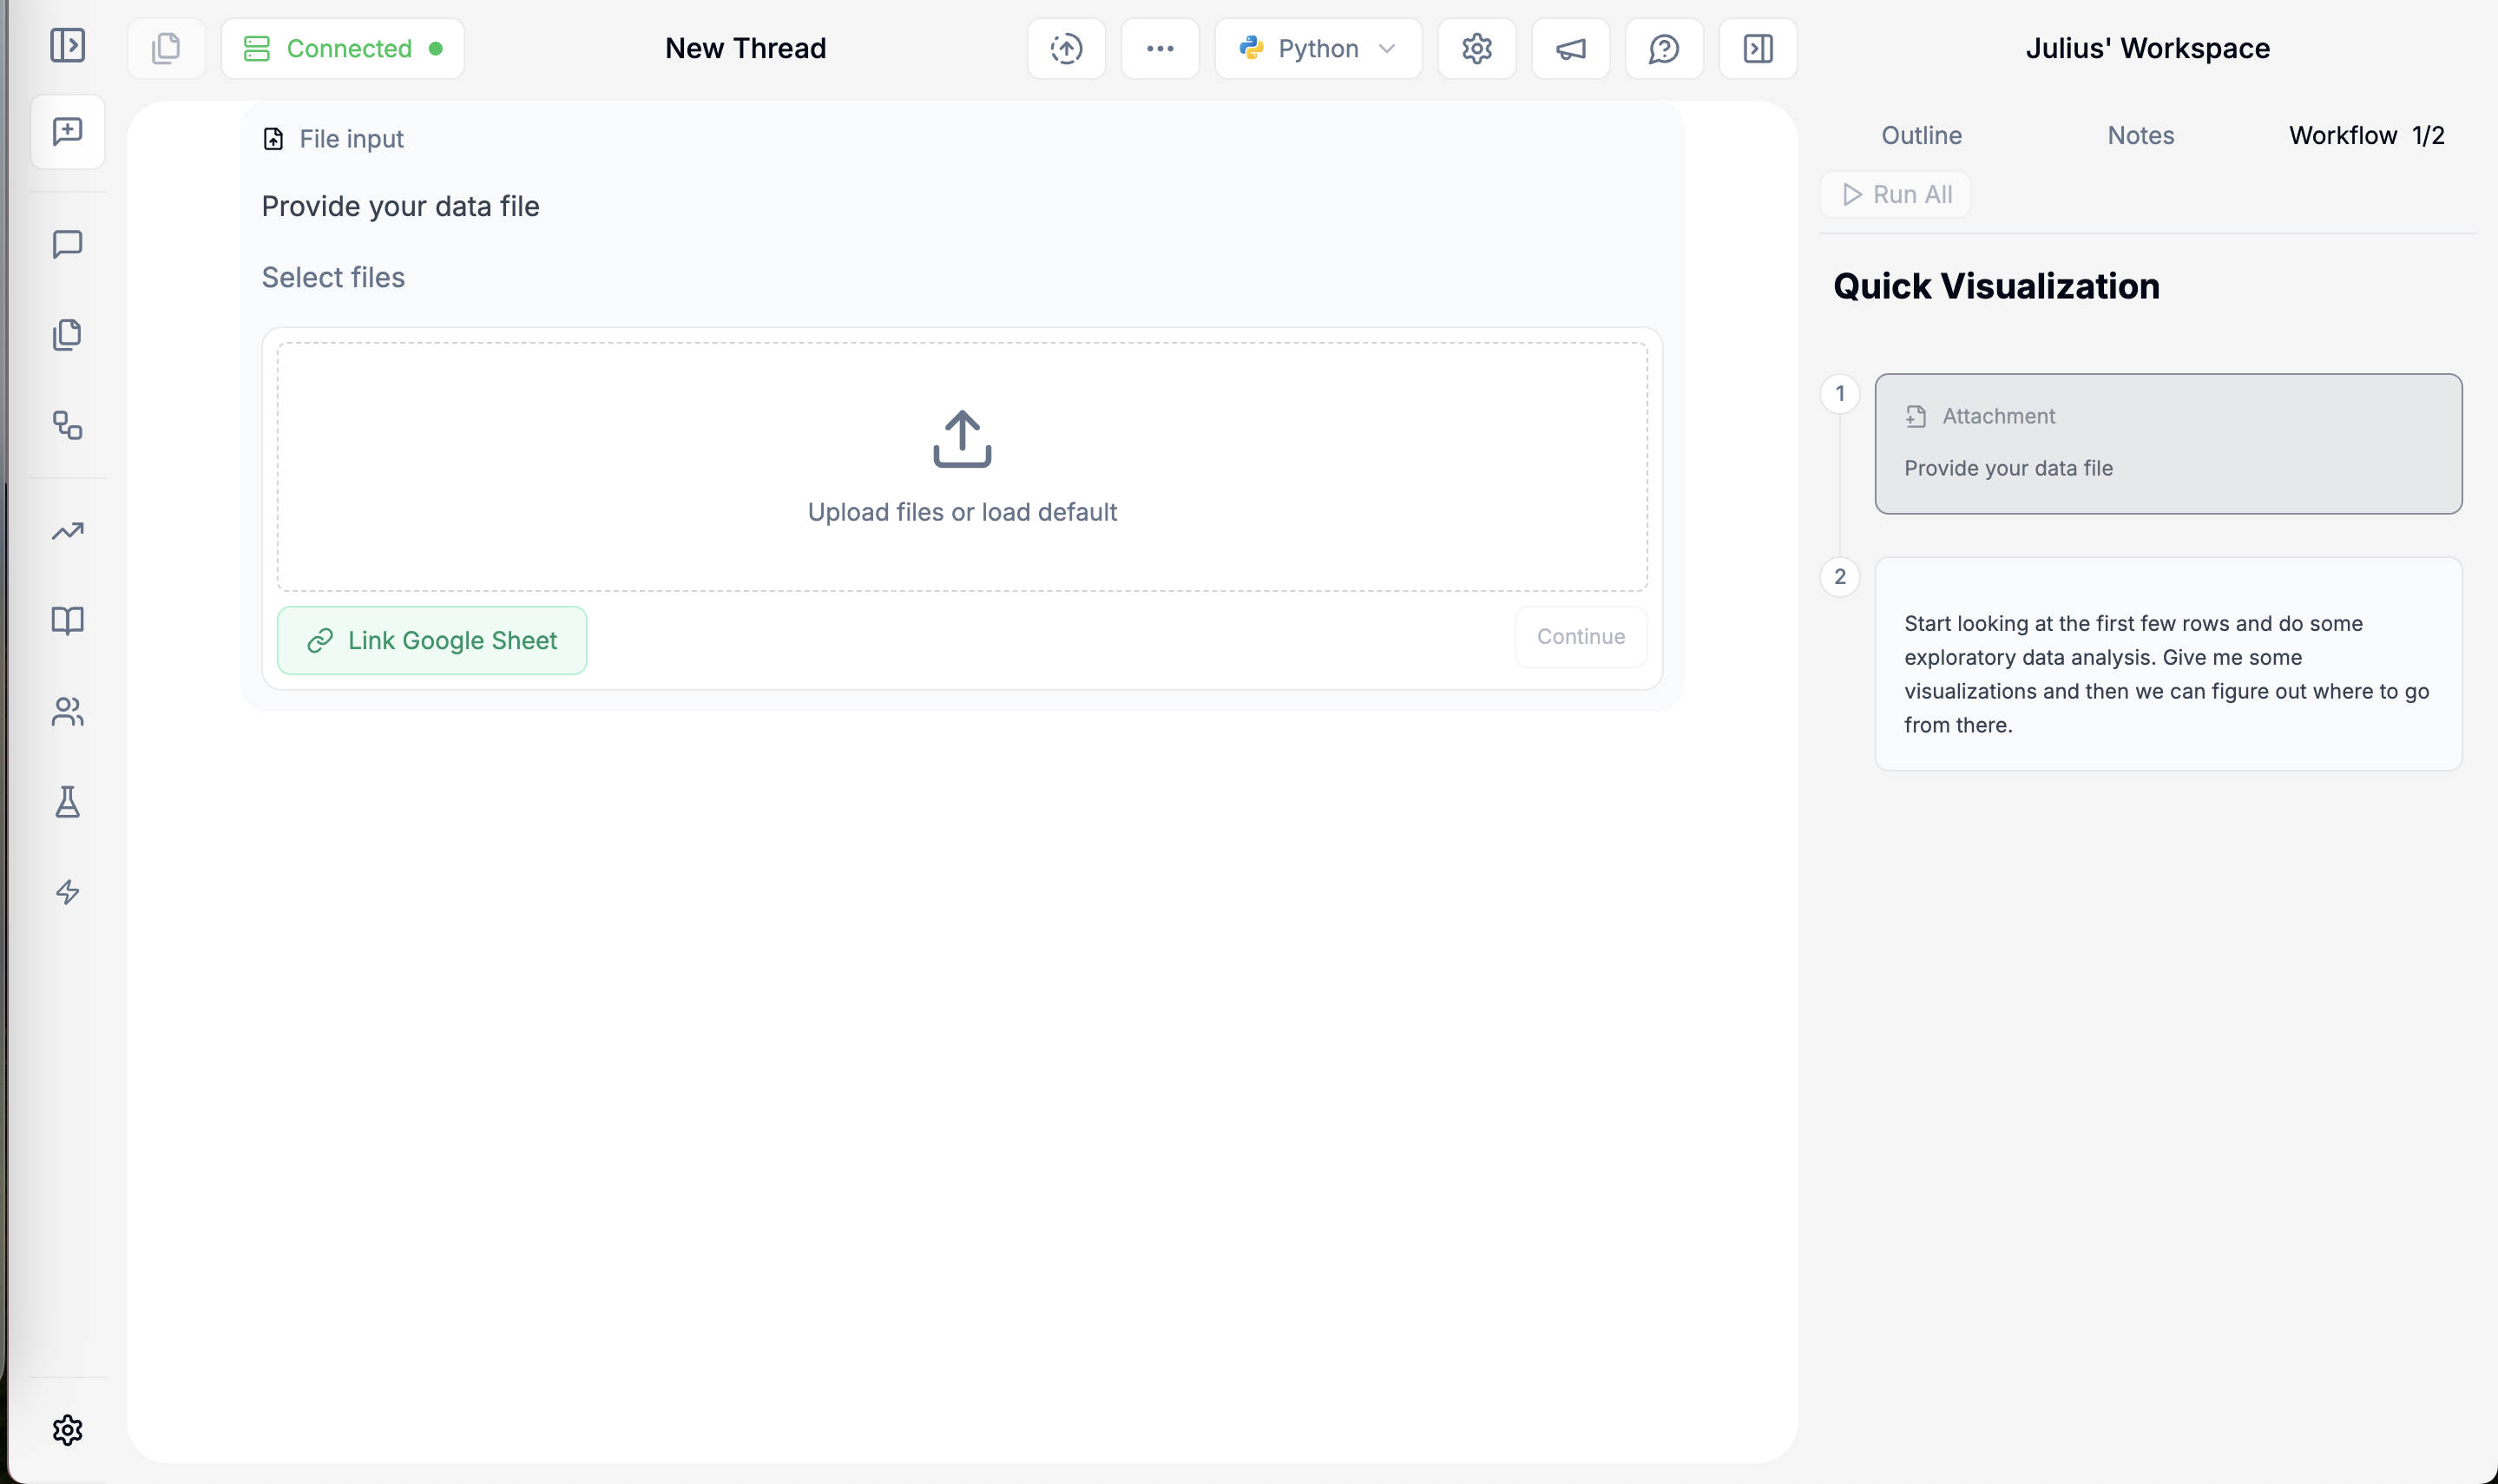
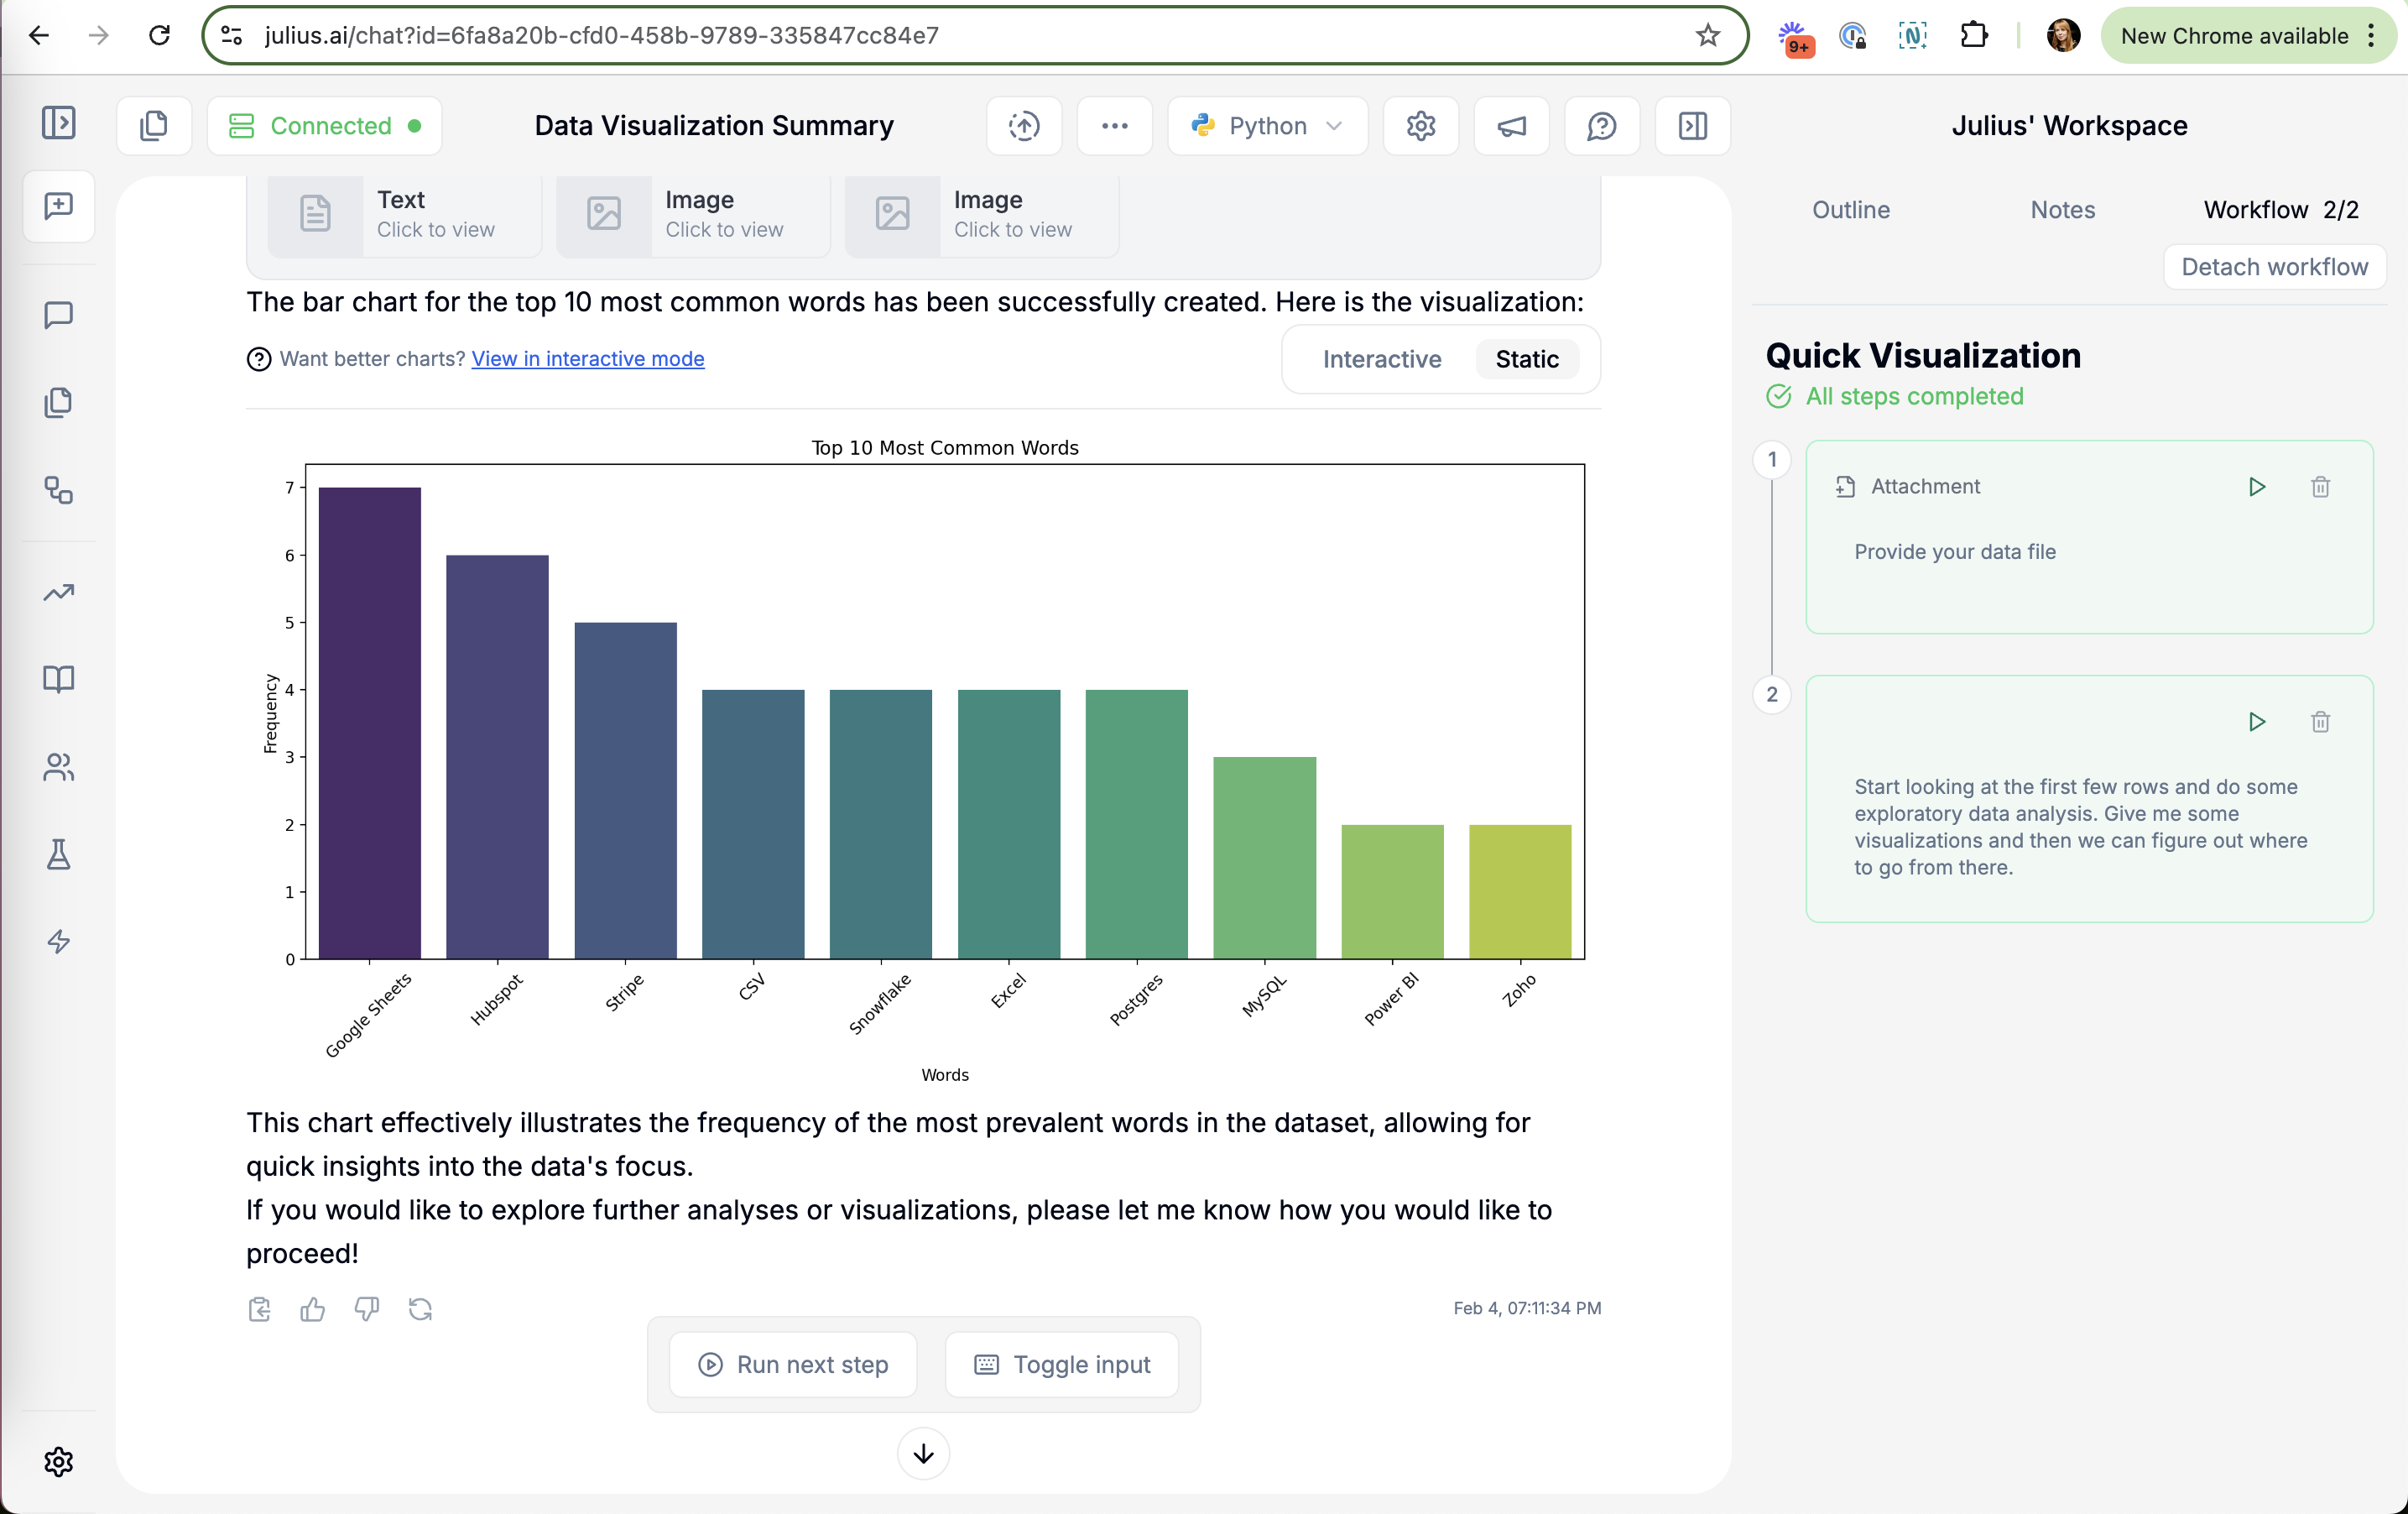
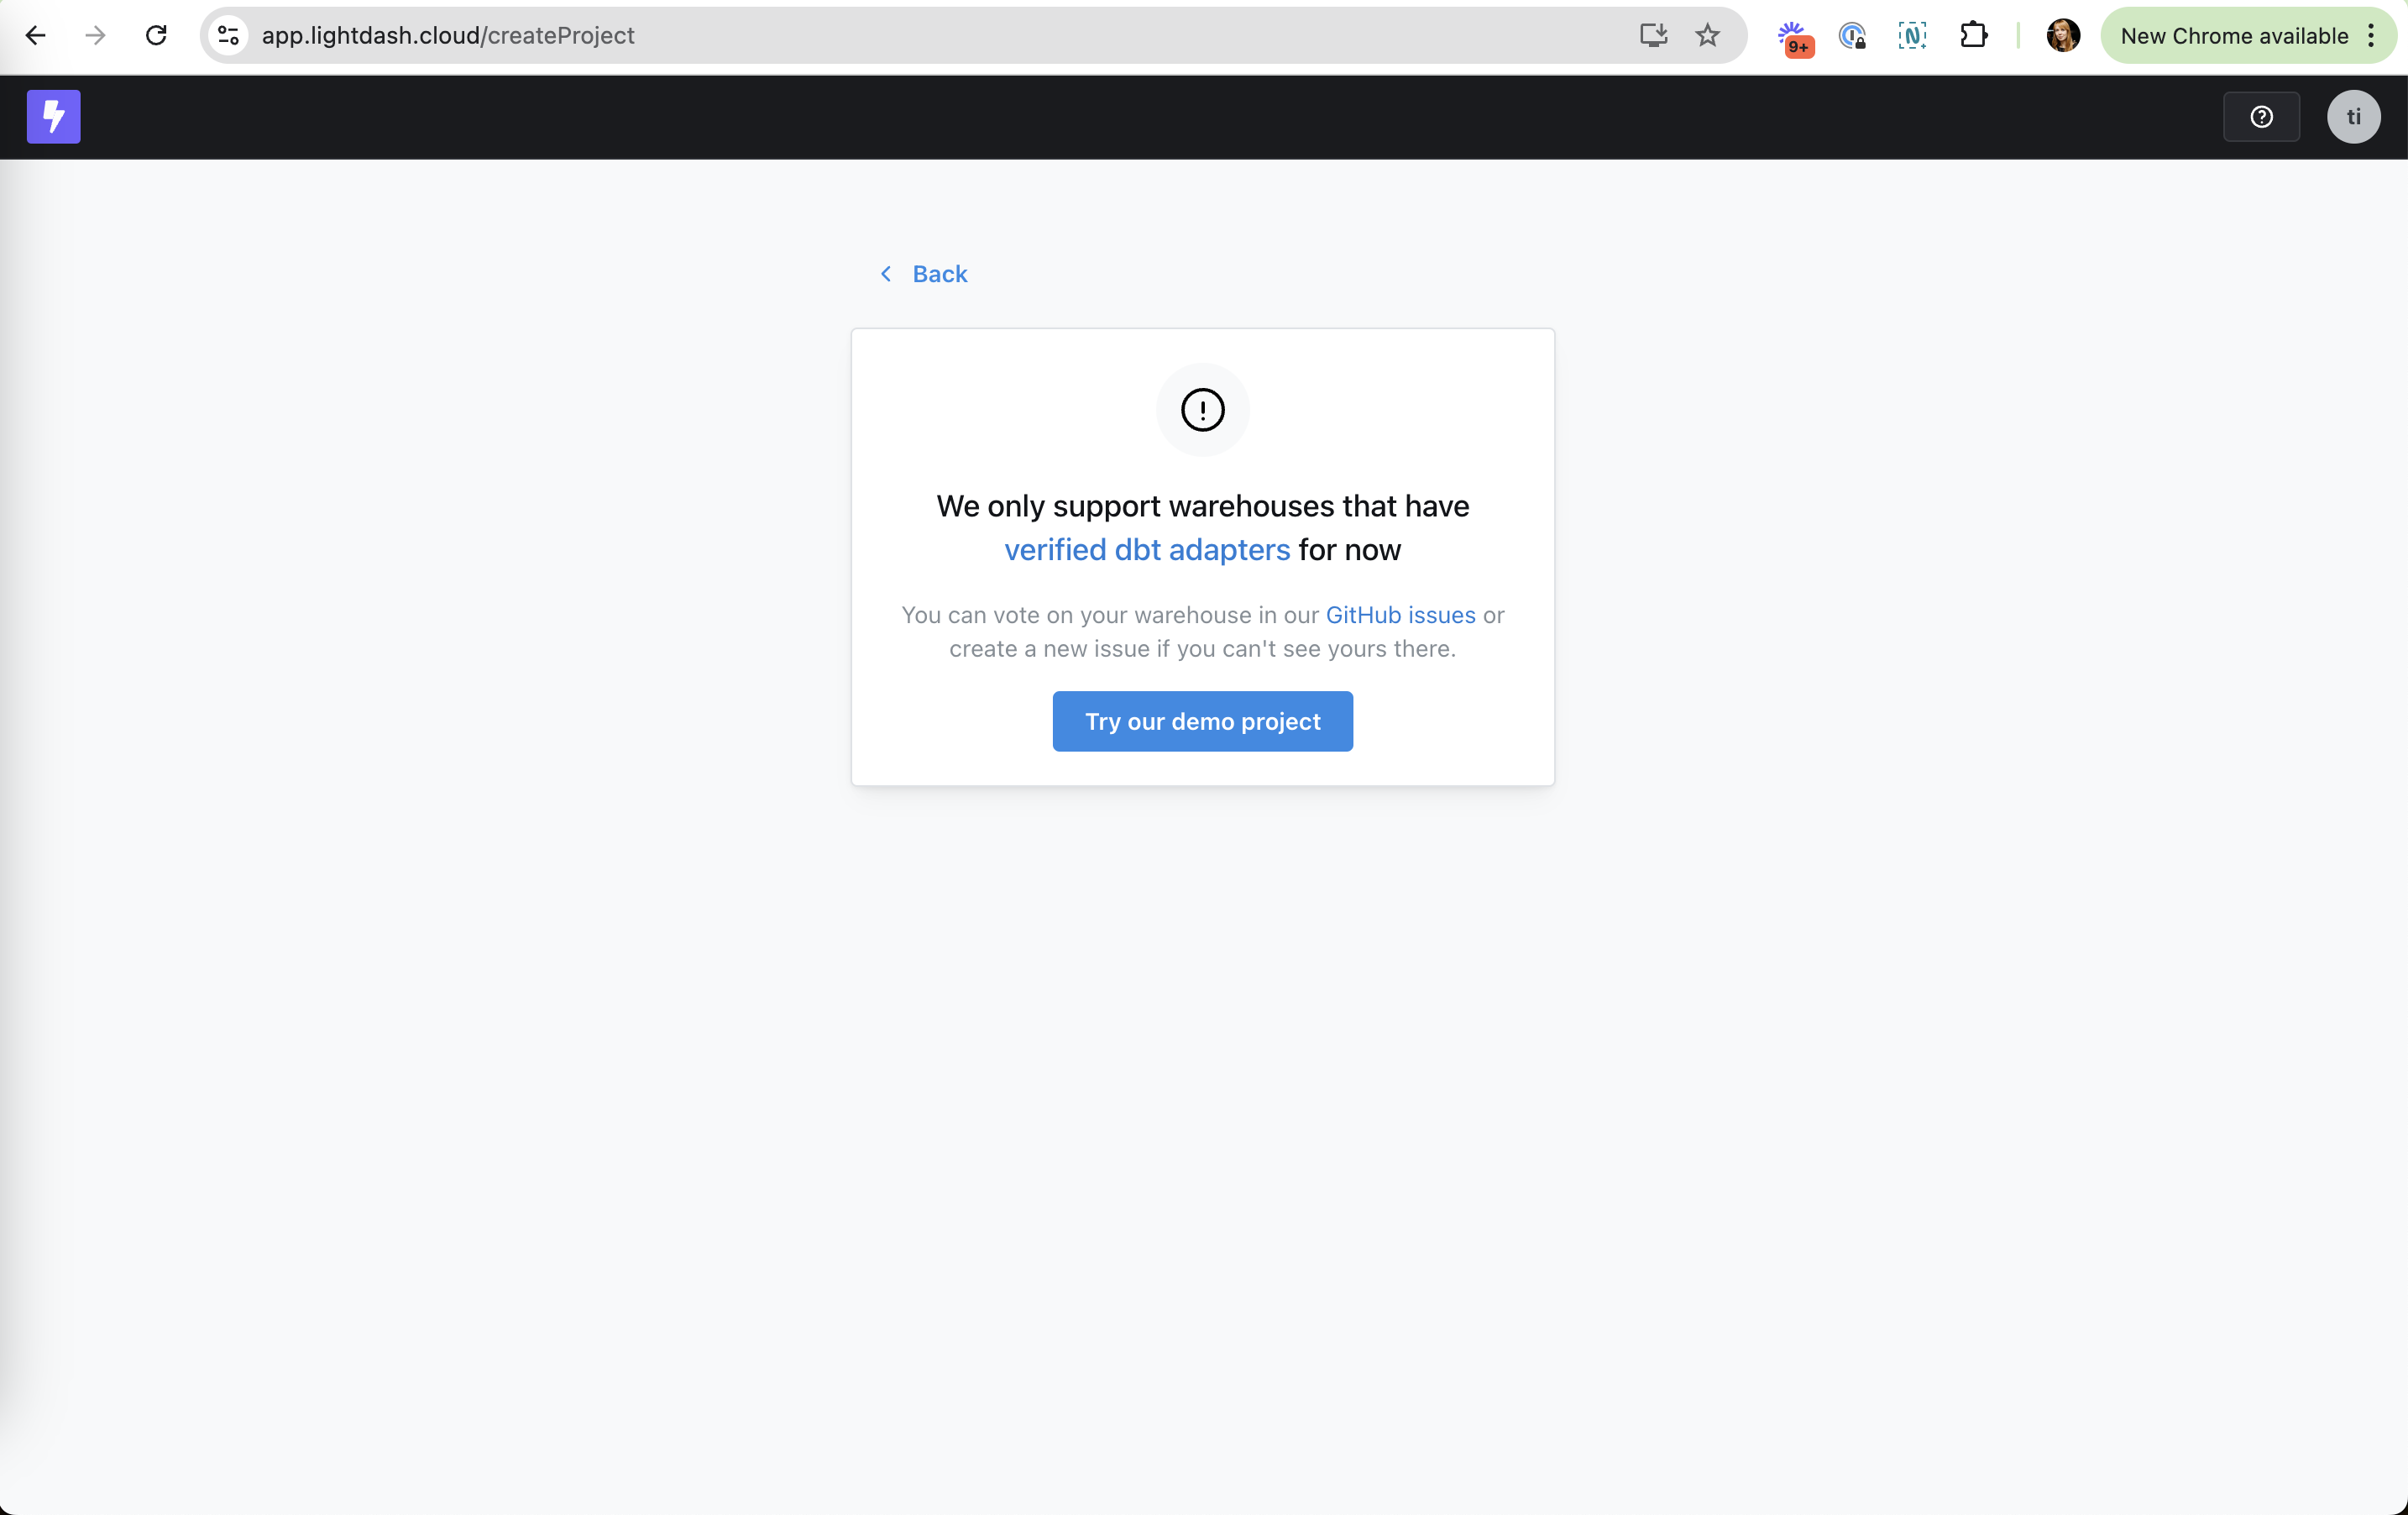
Visibility of system status in real products 21 working · 3 not

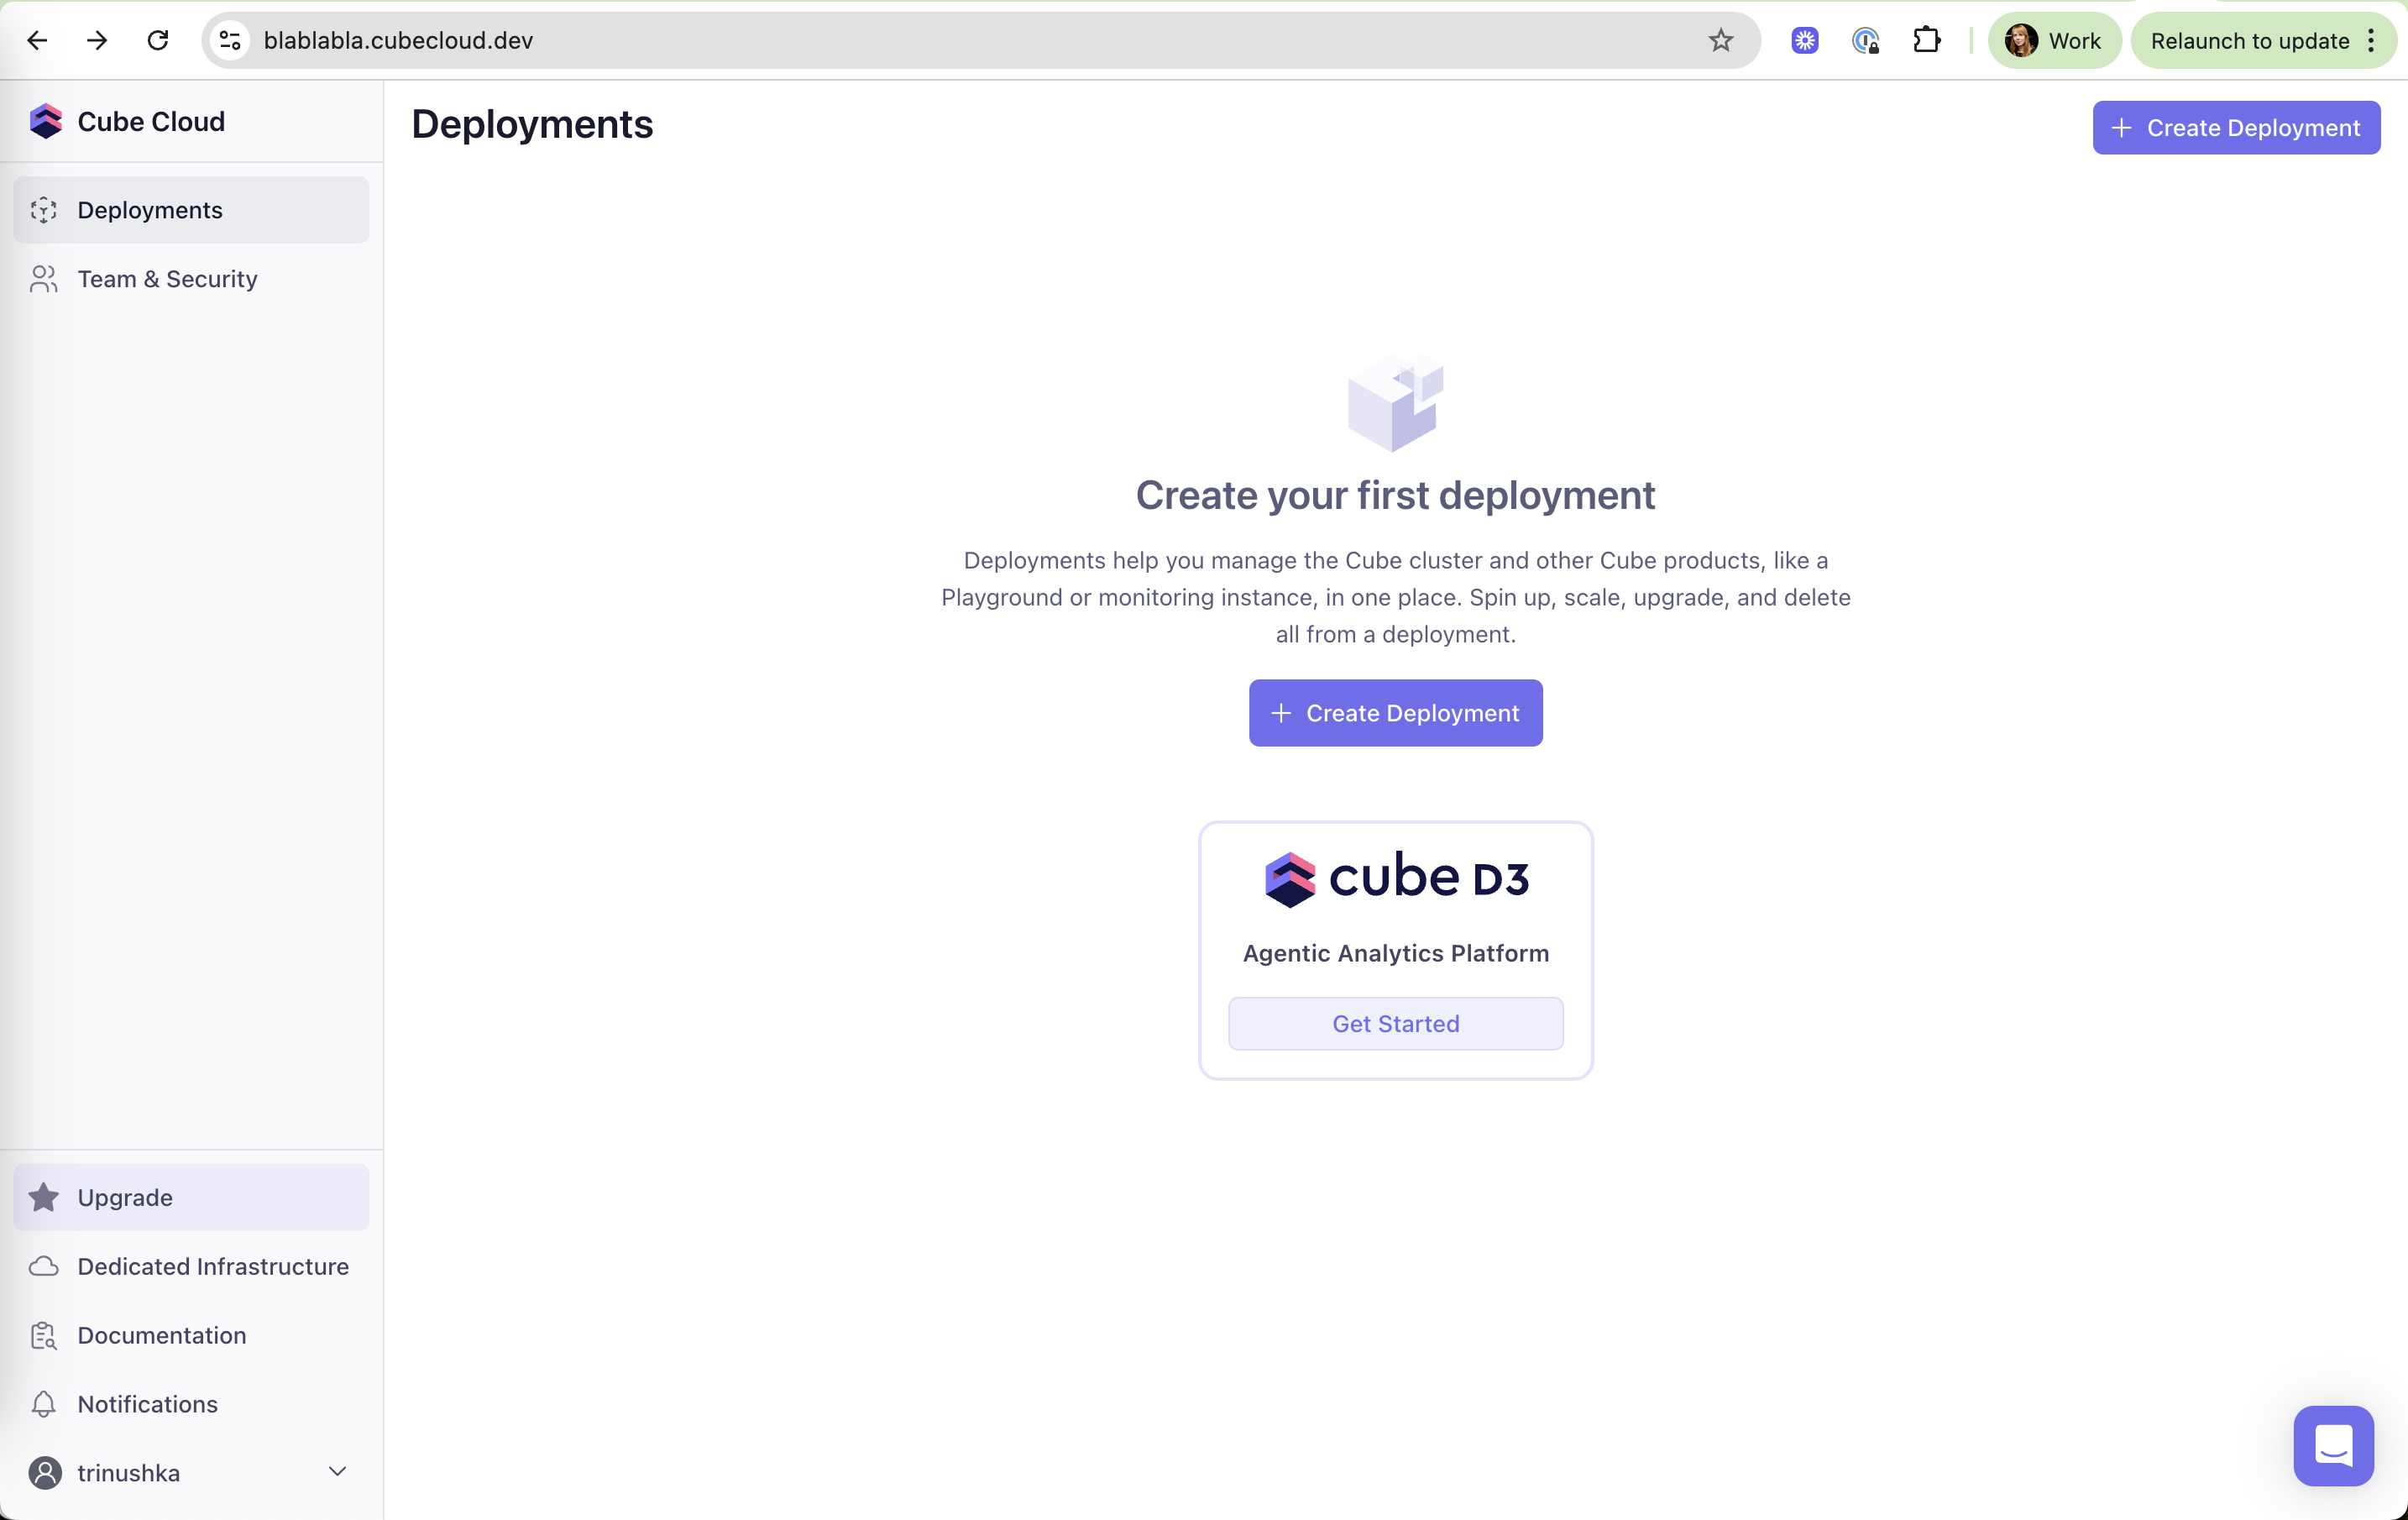
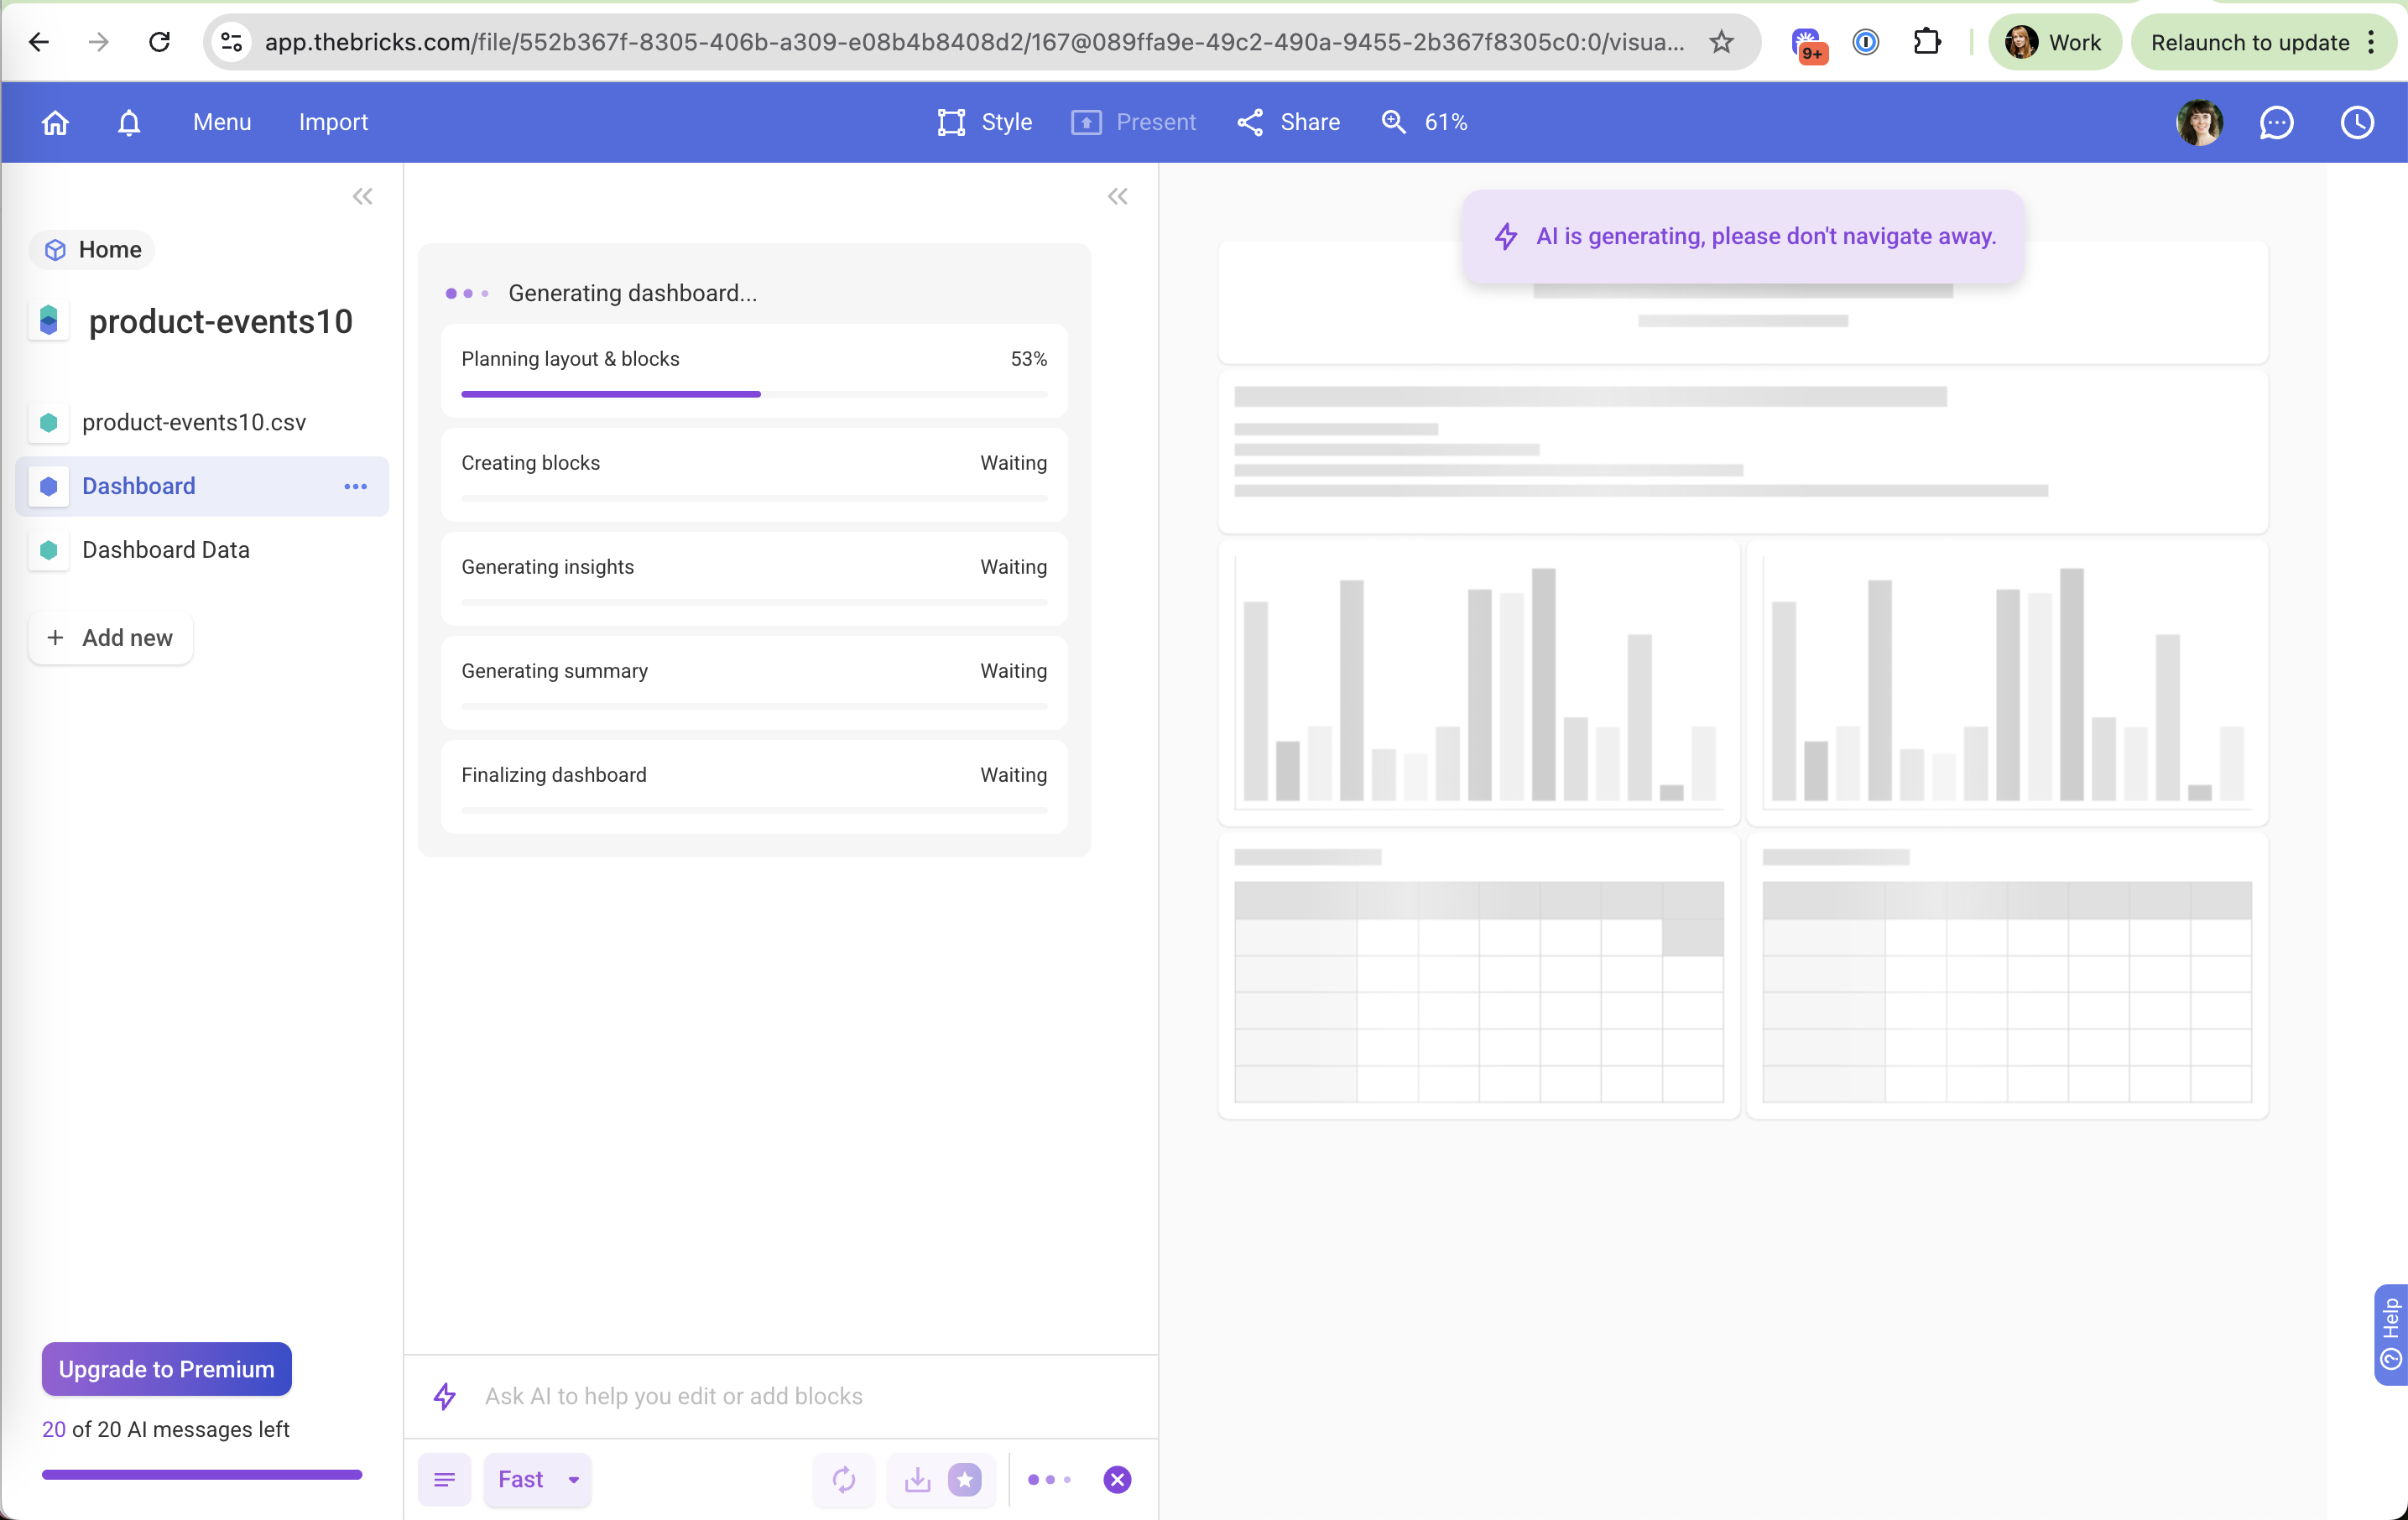
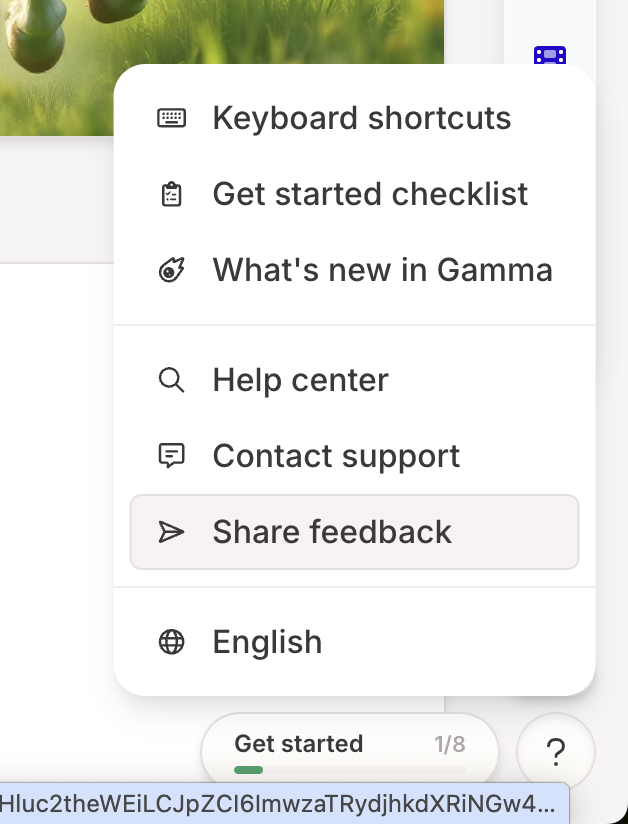
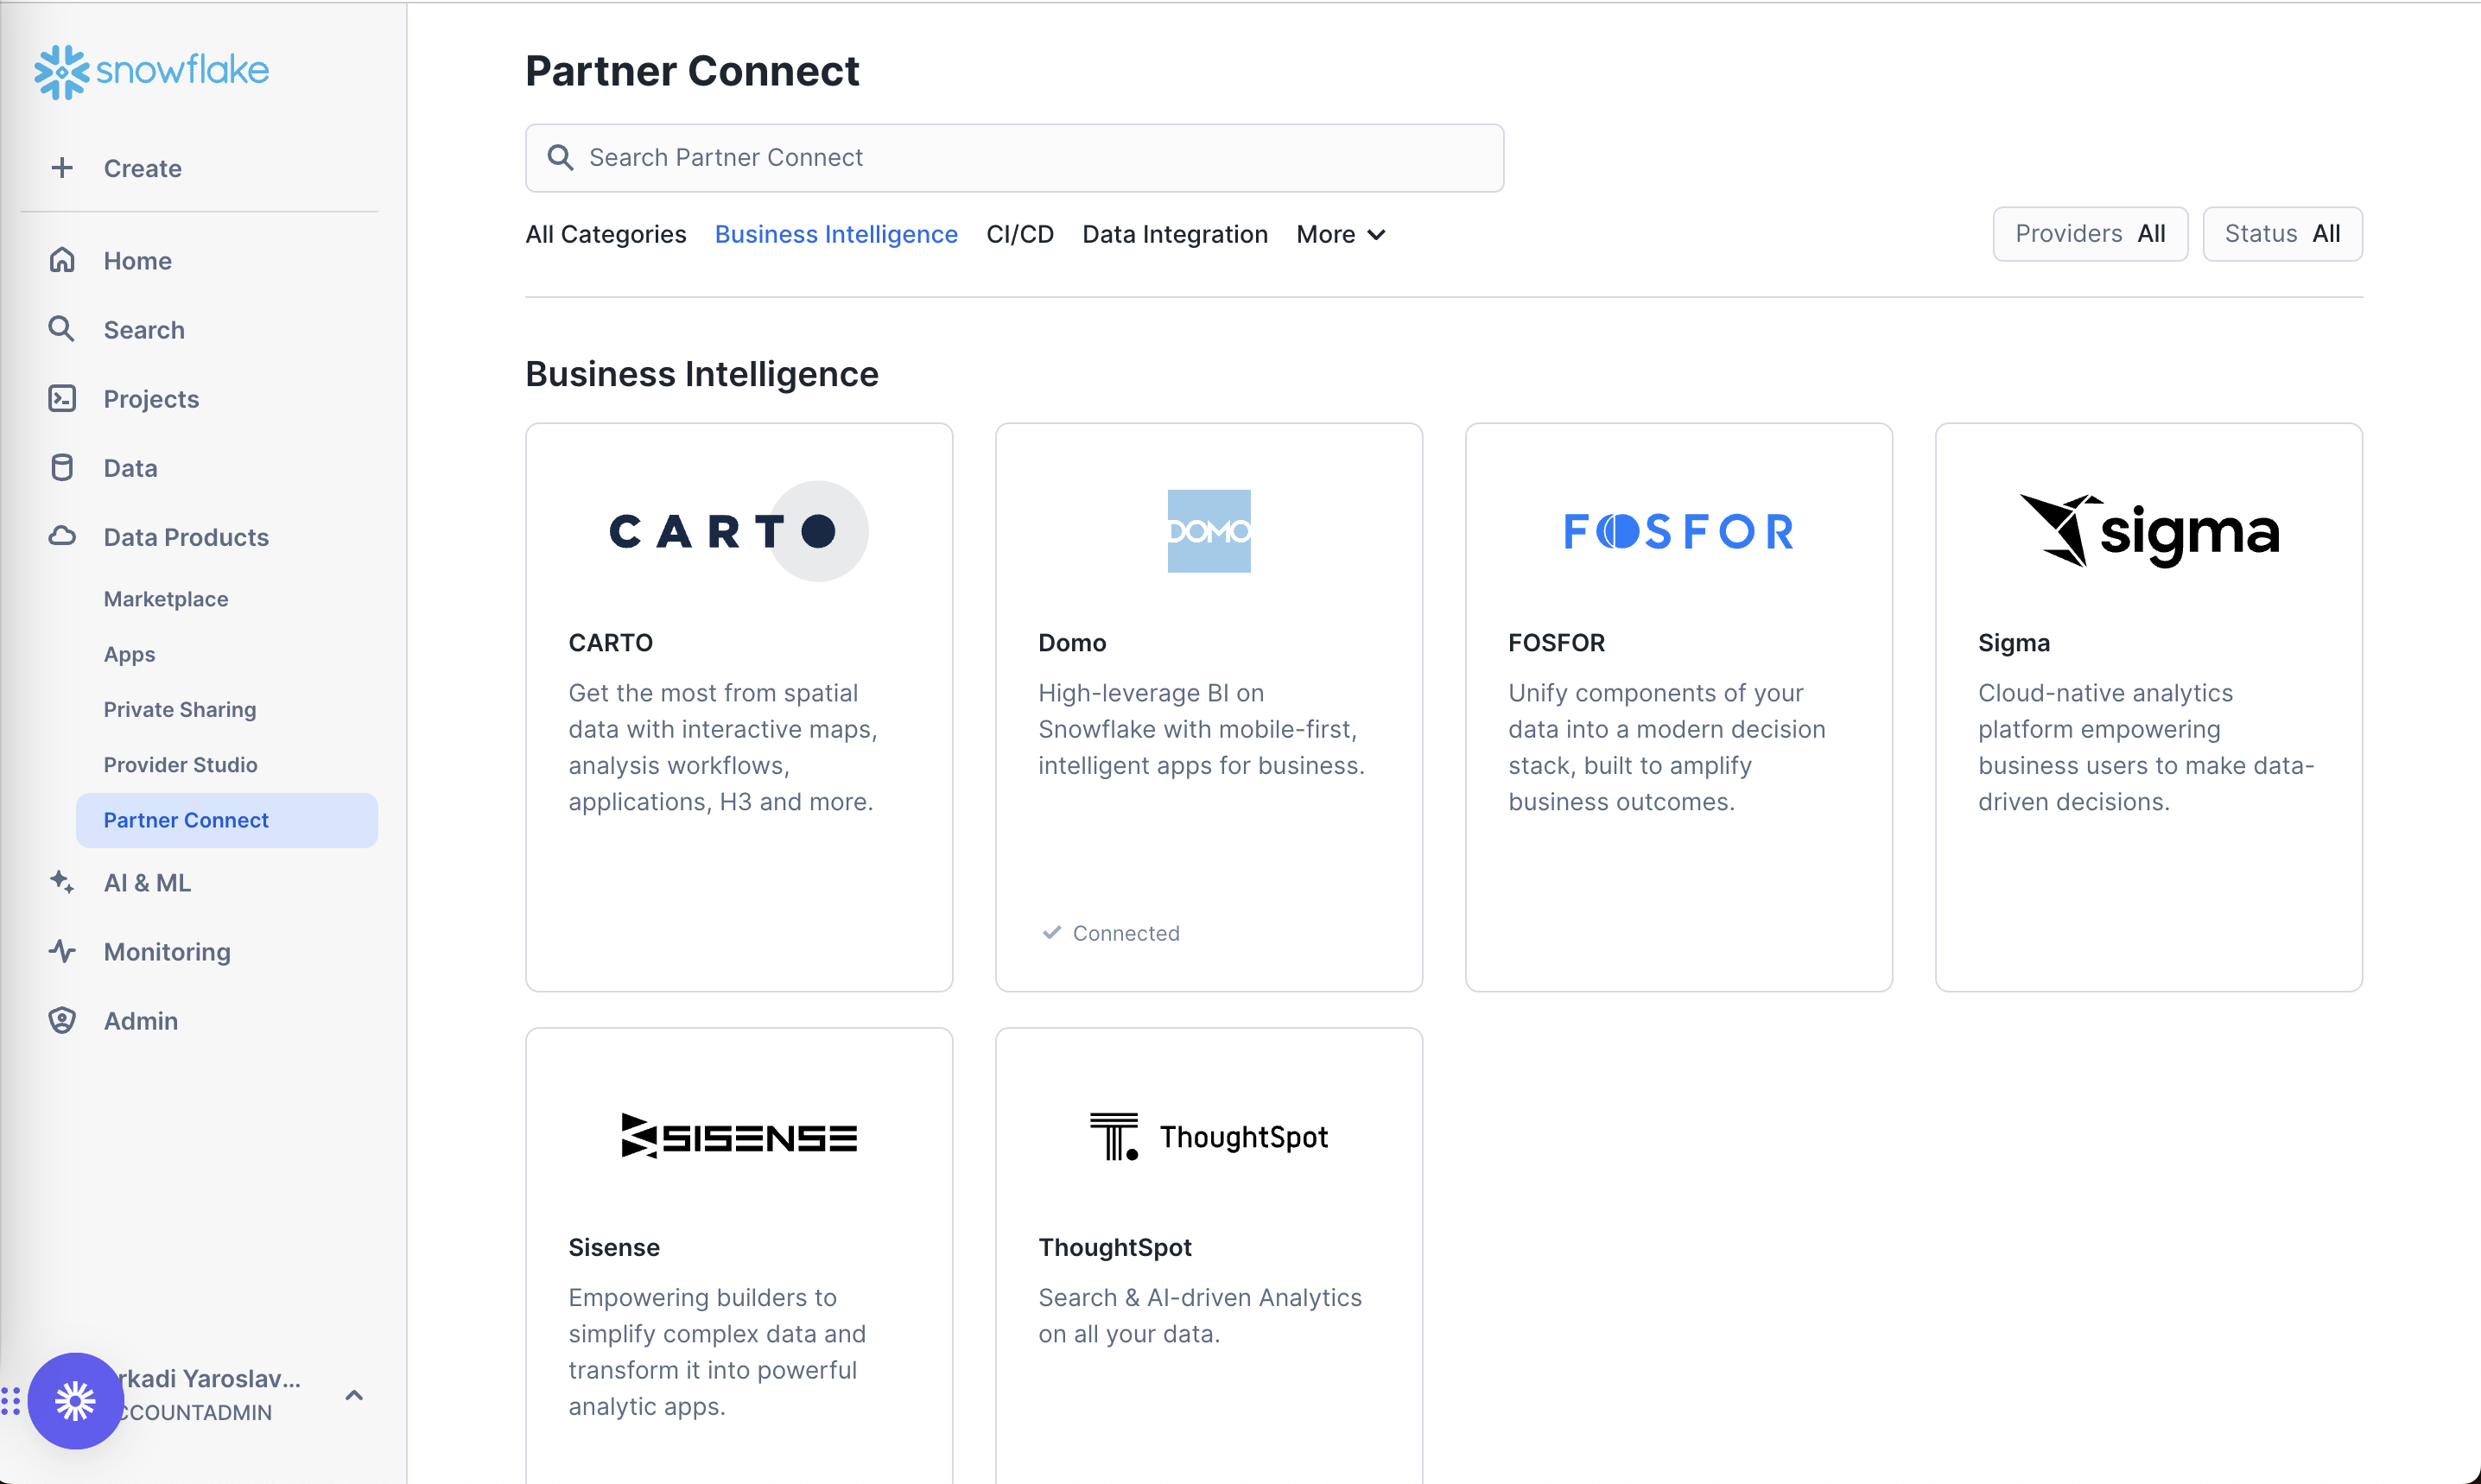
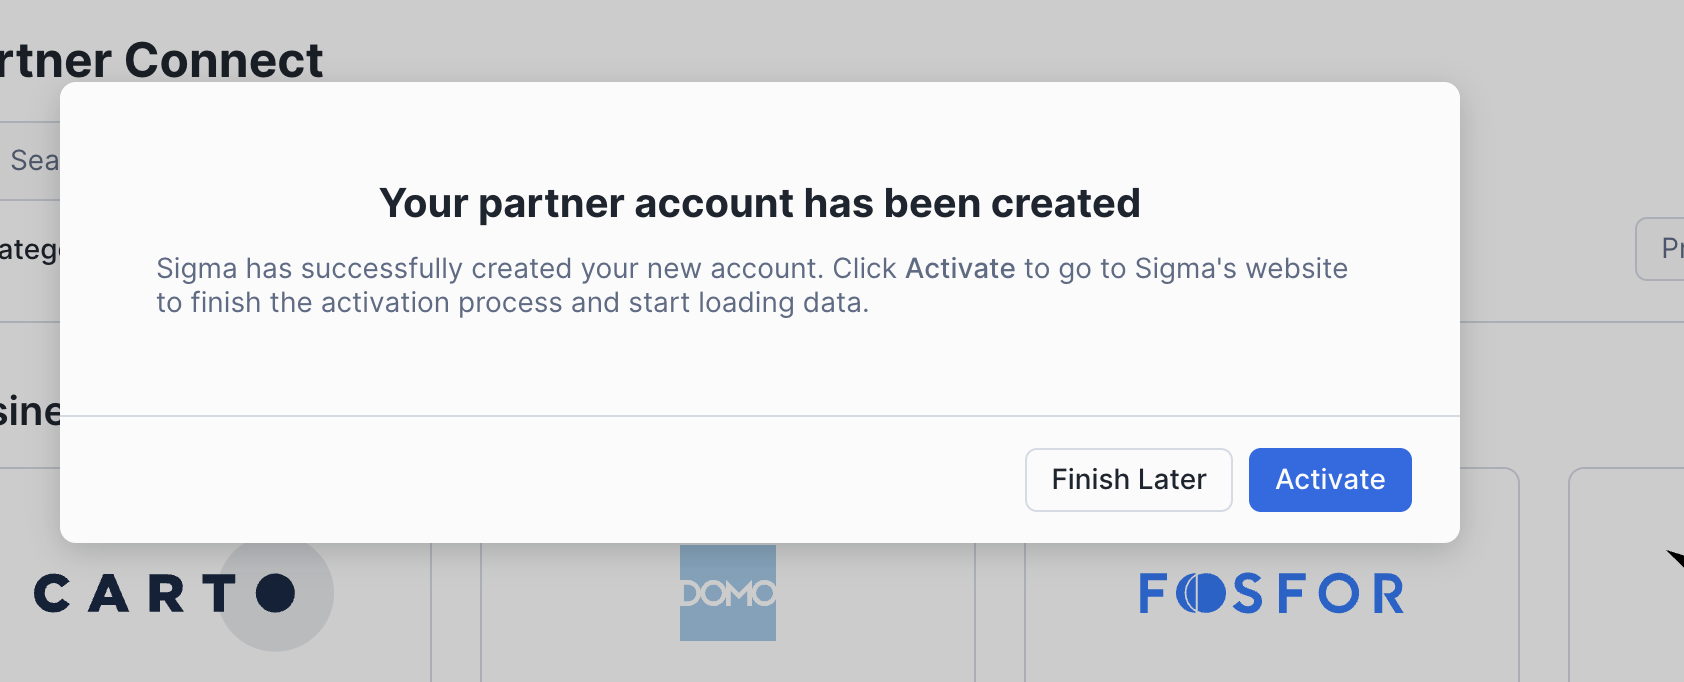
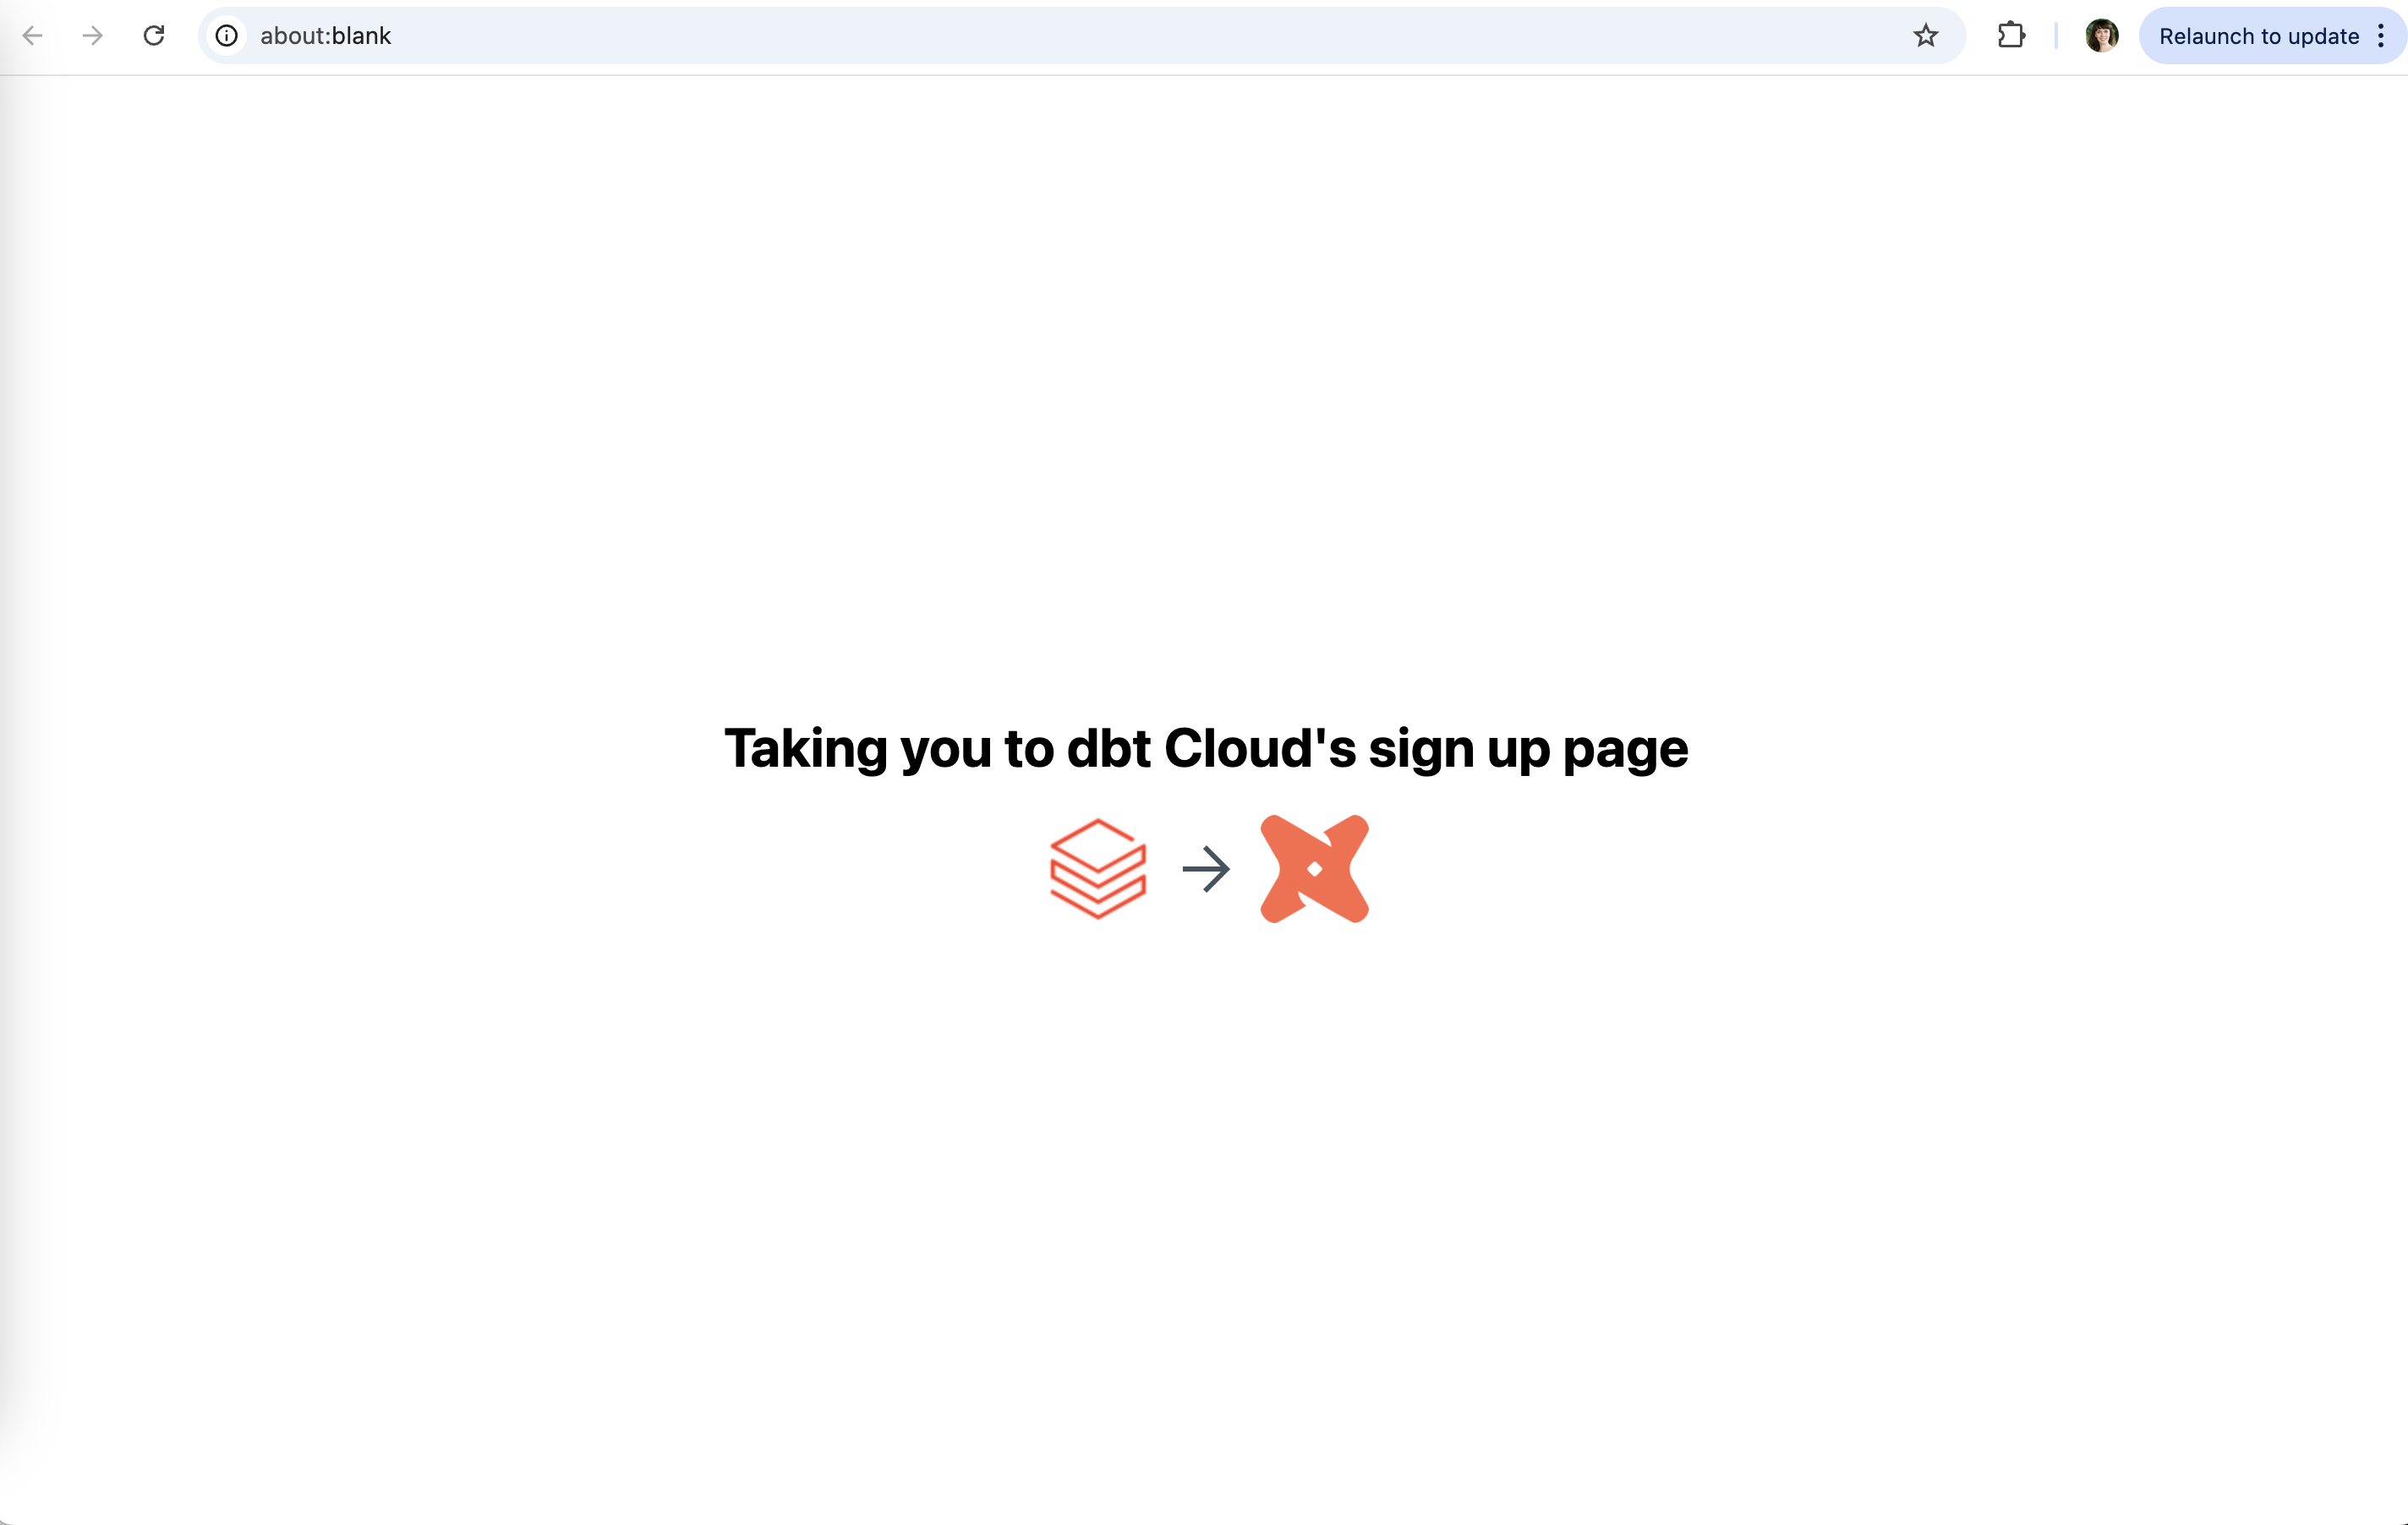
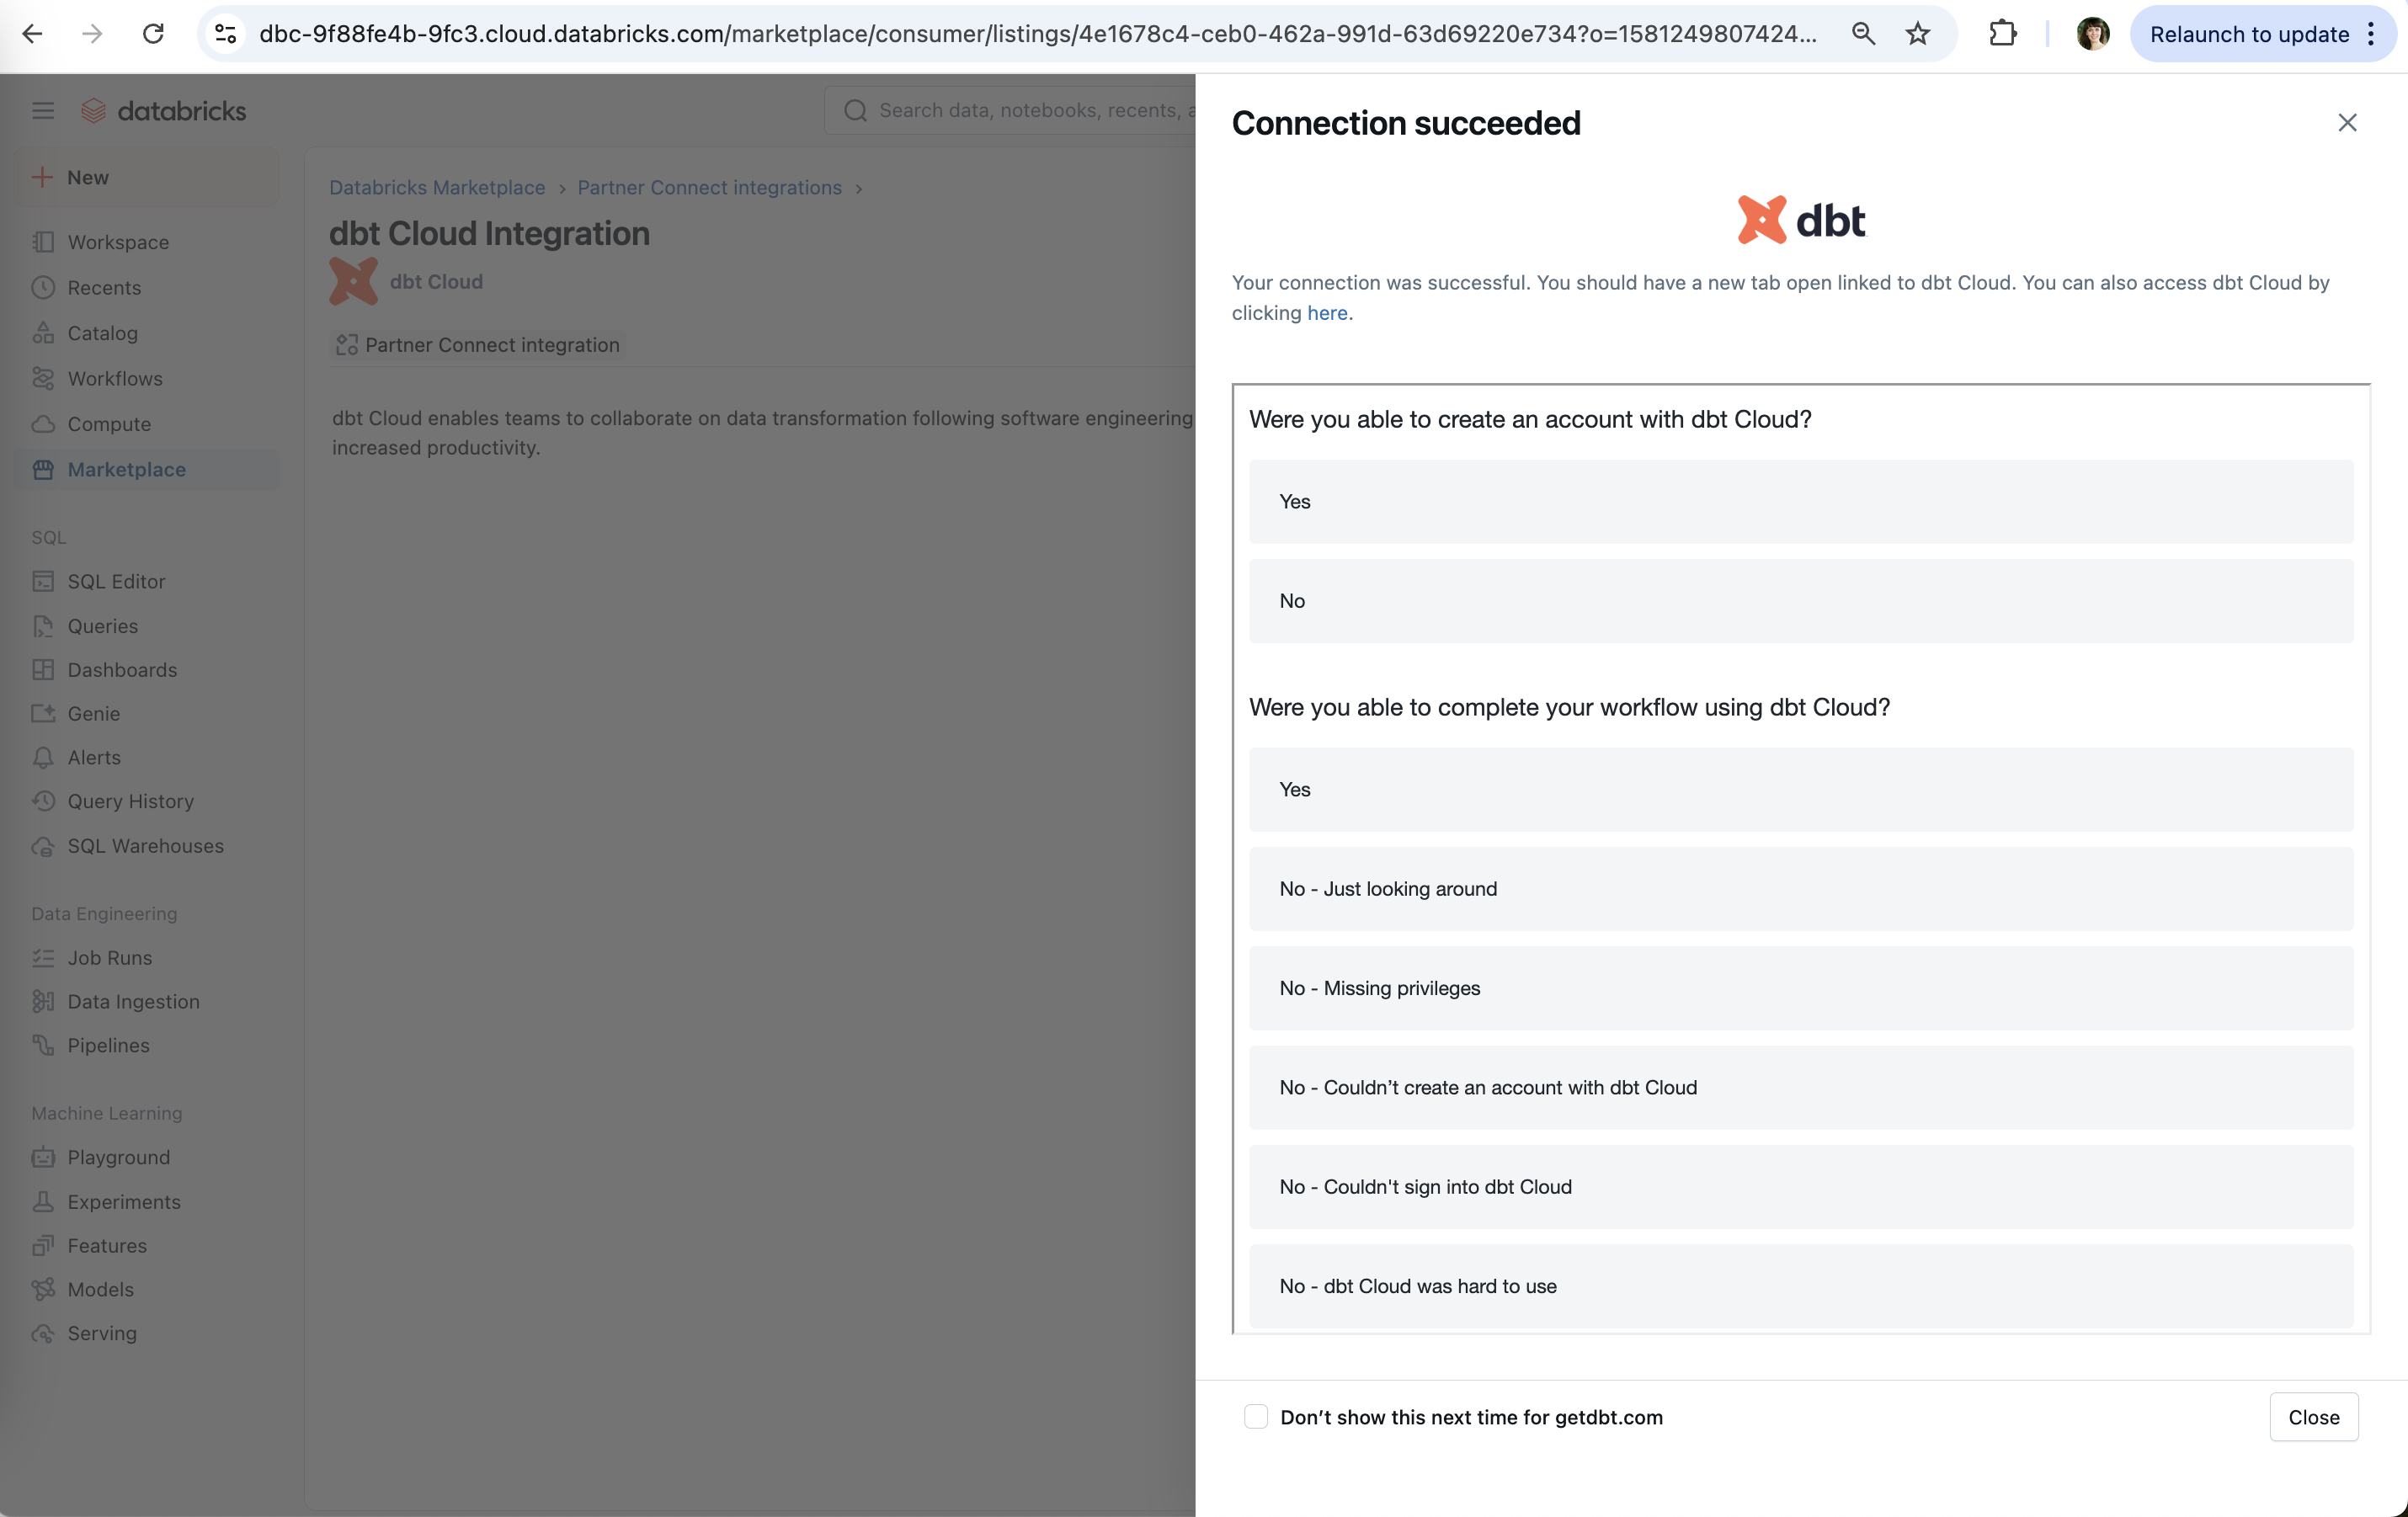
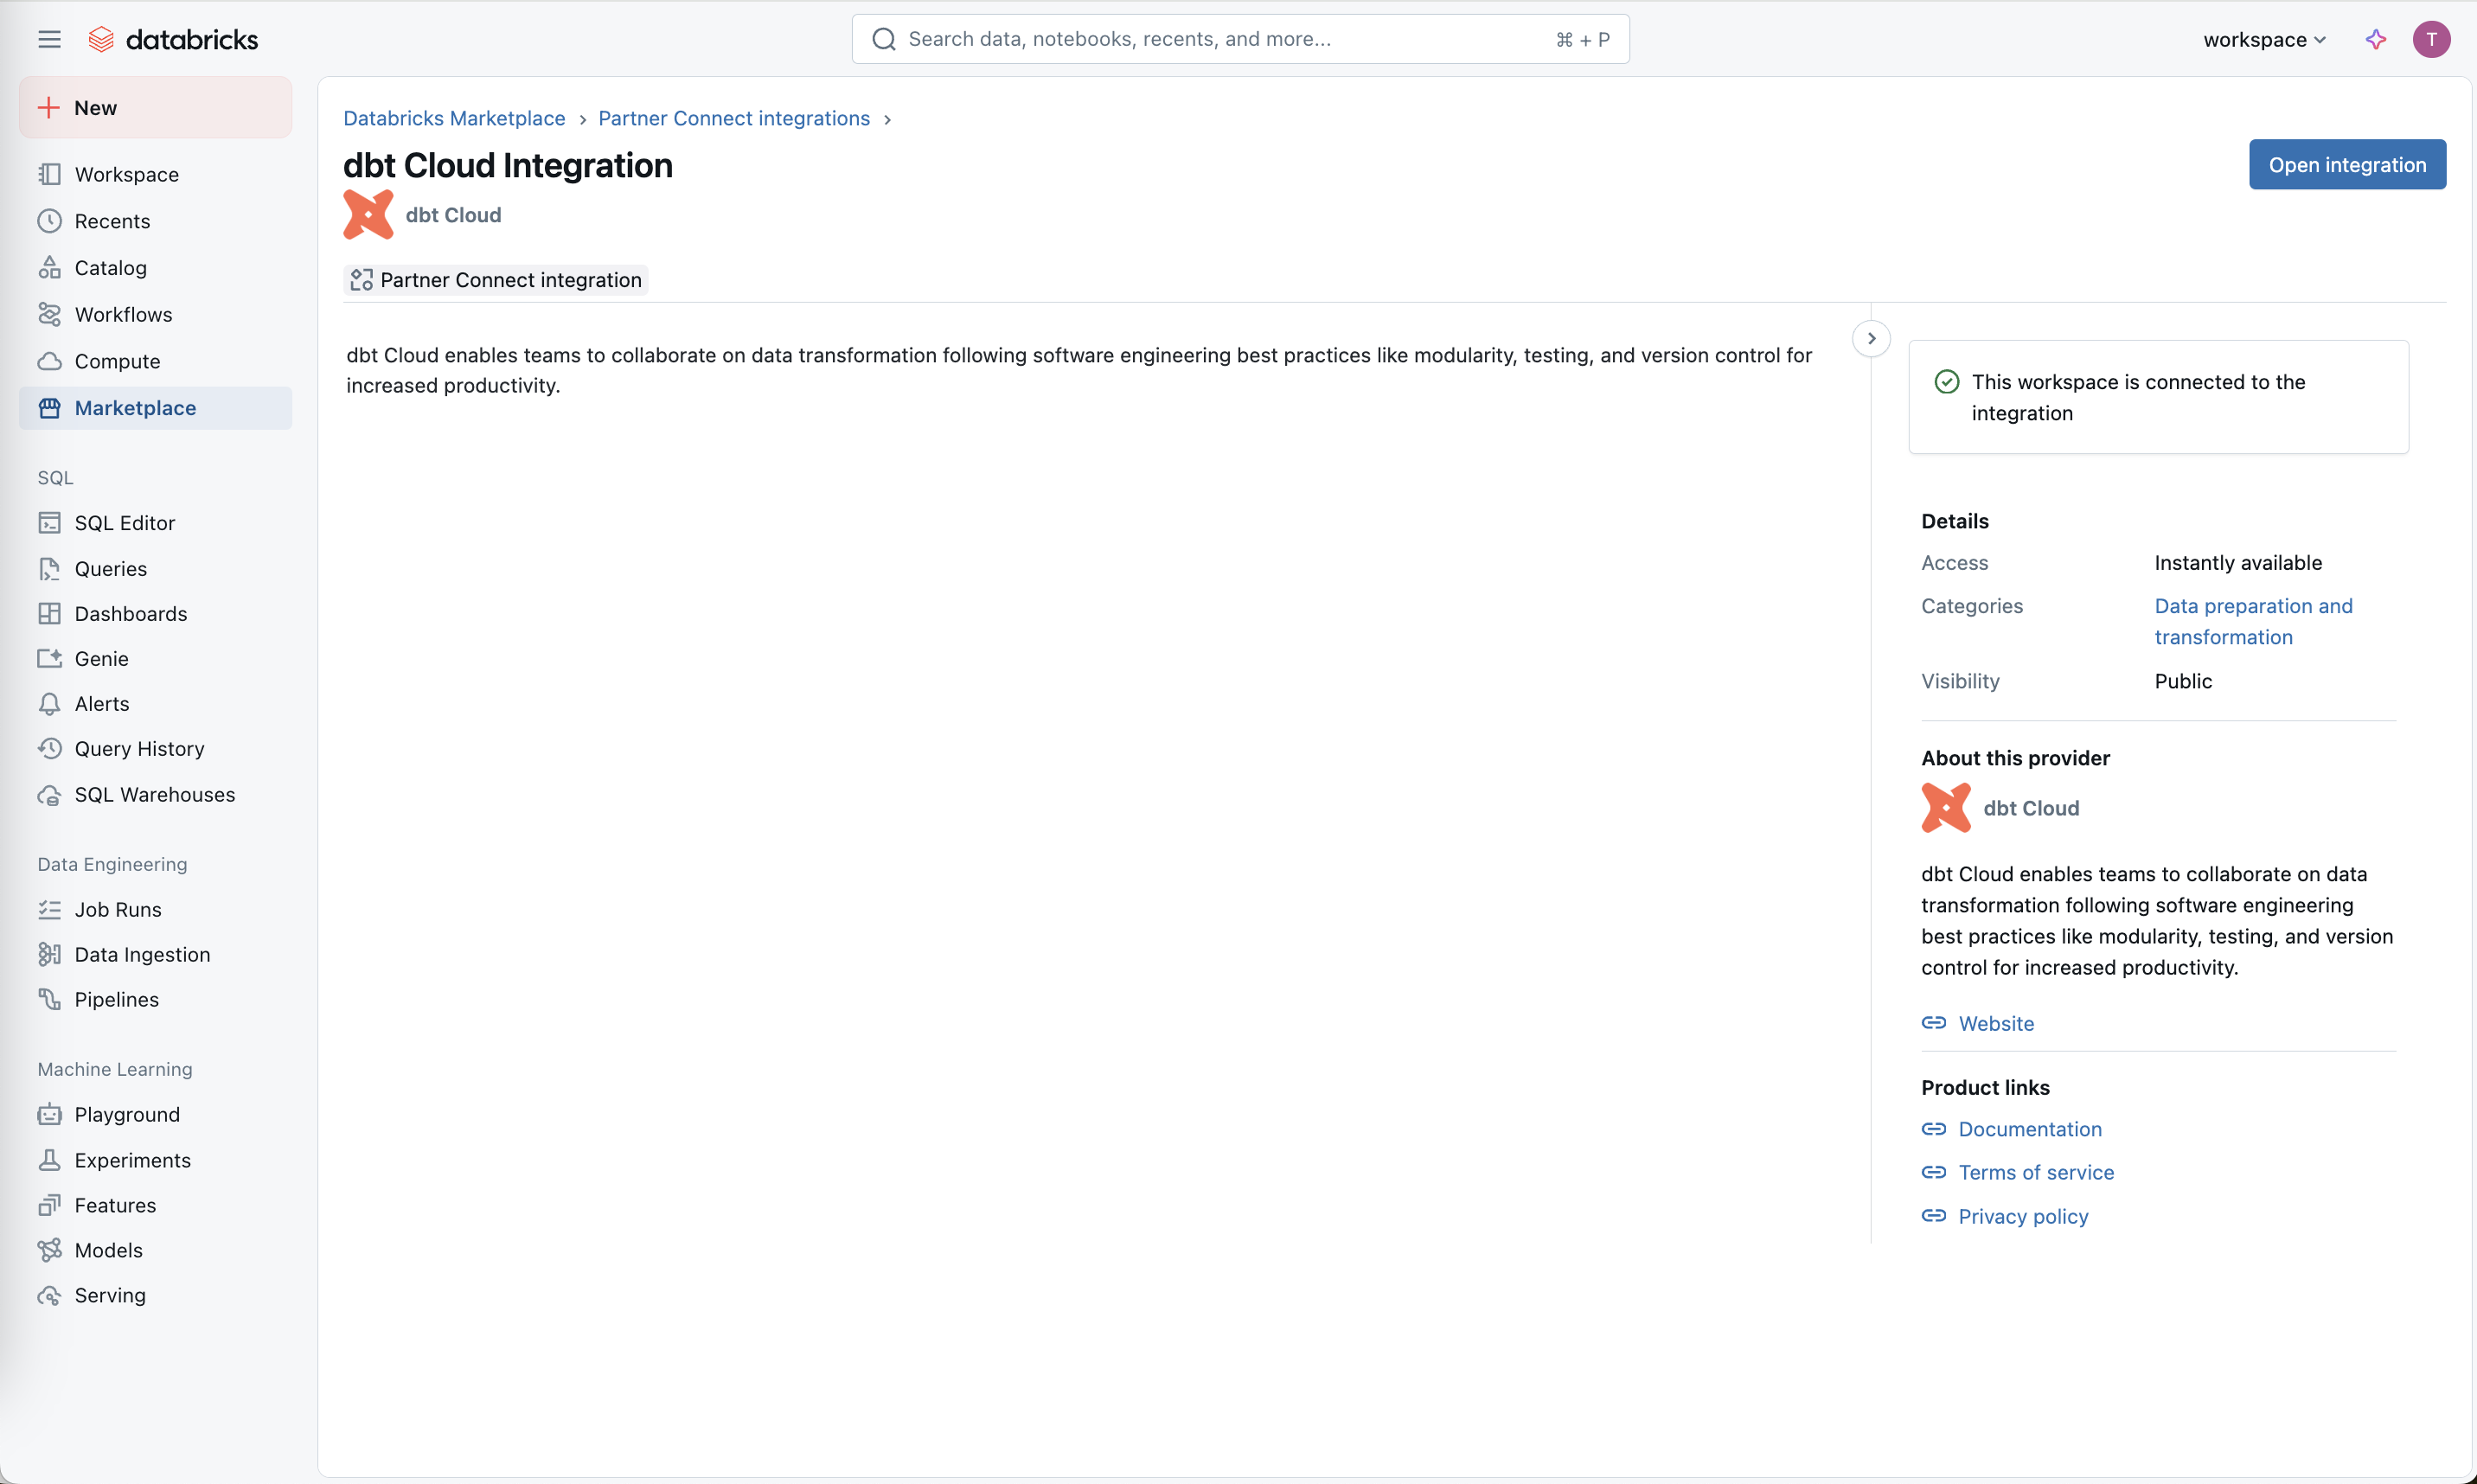
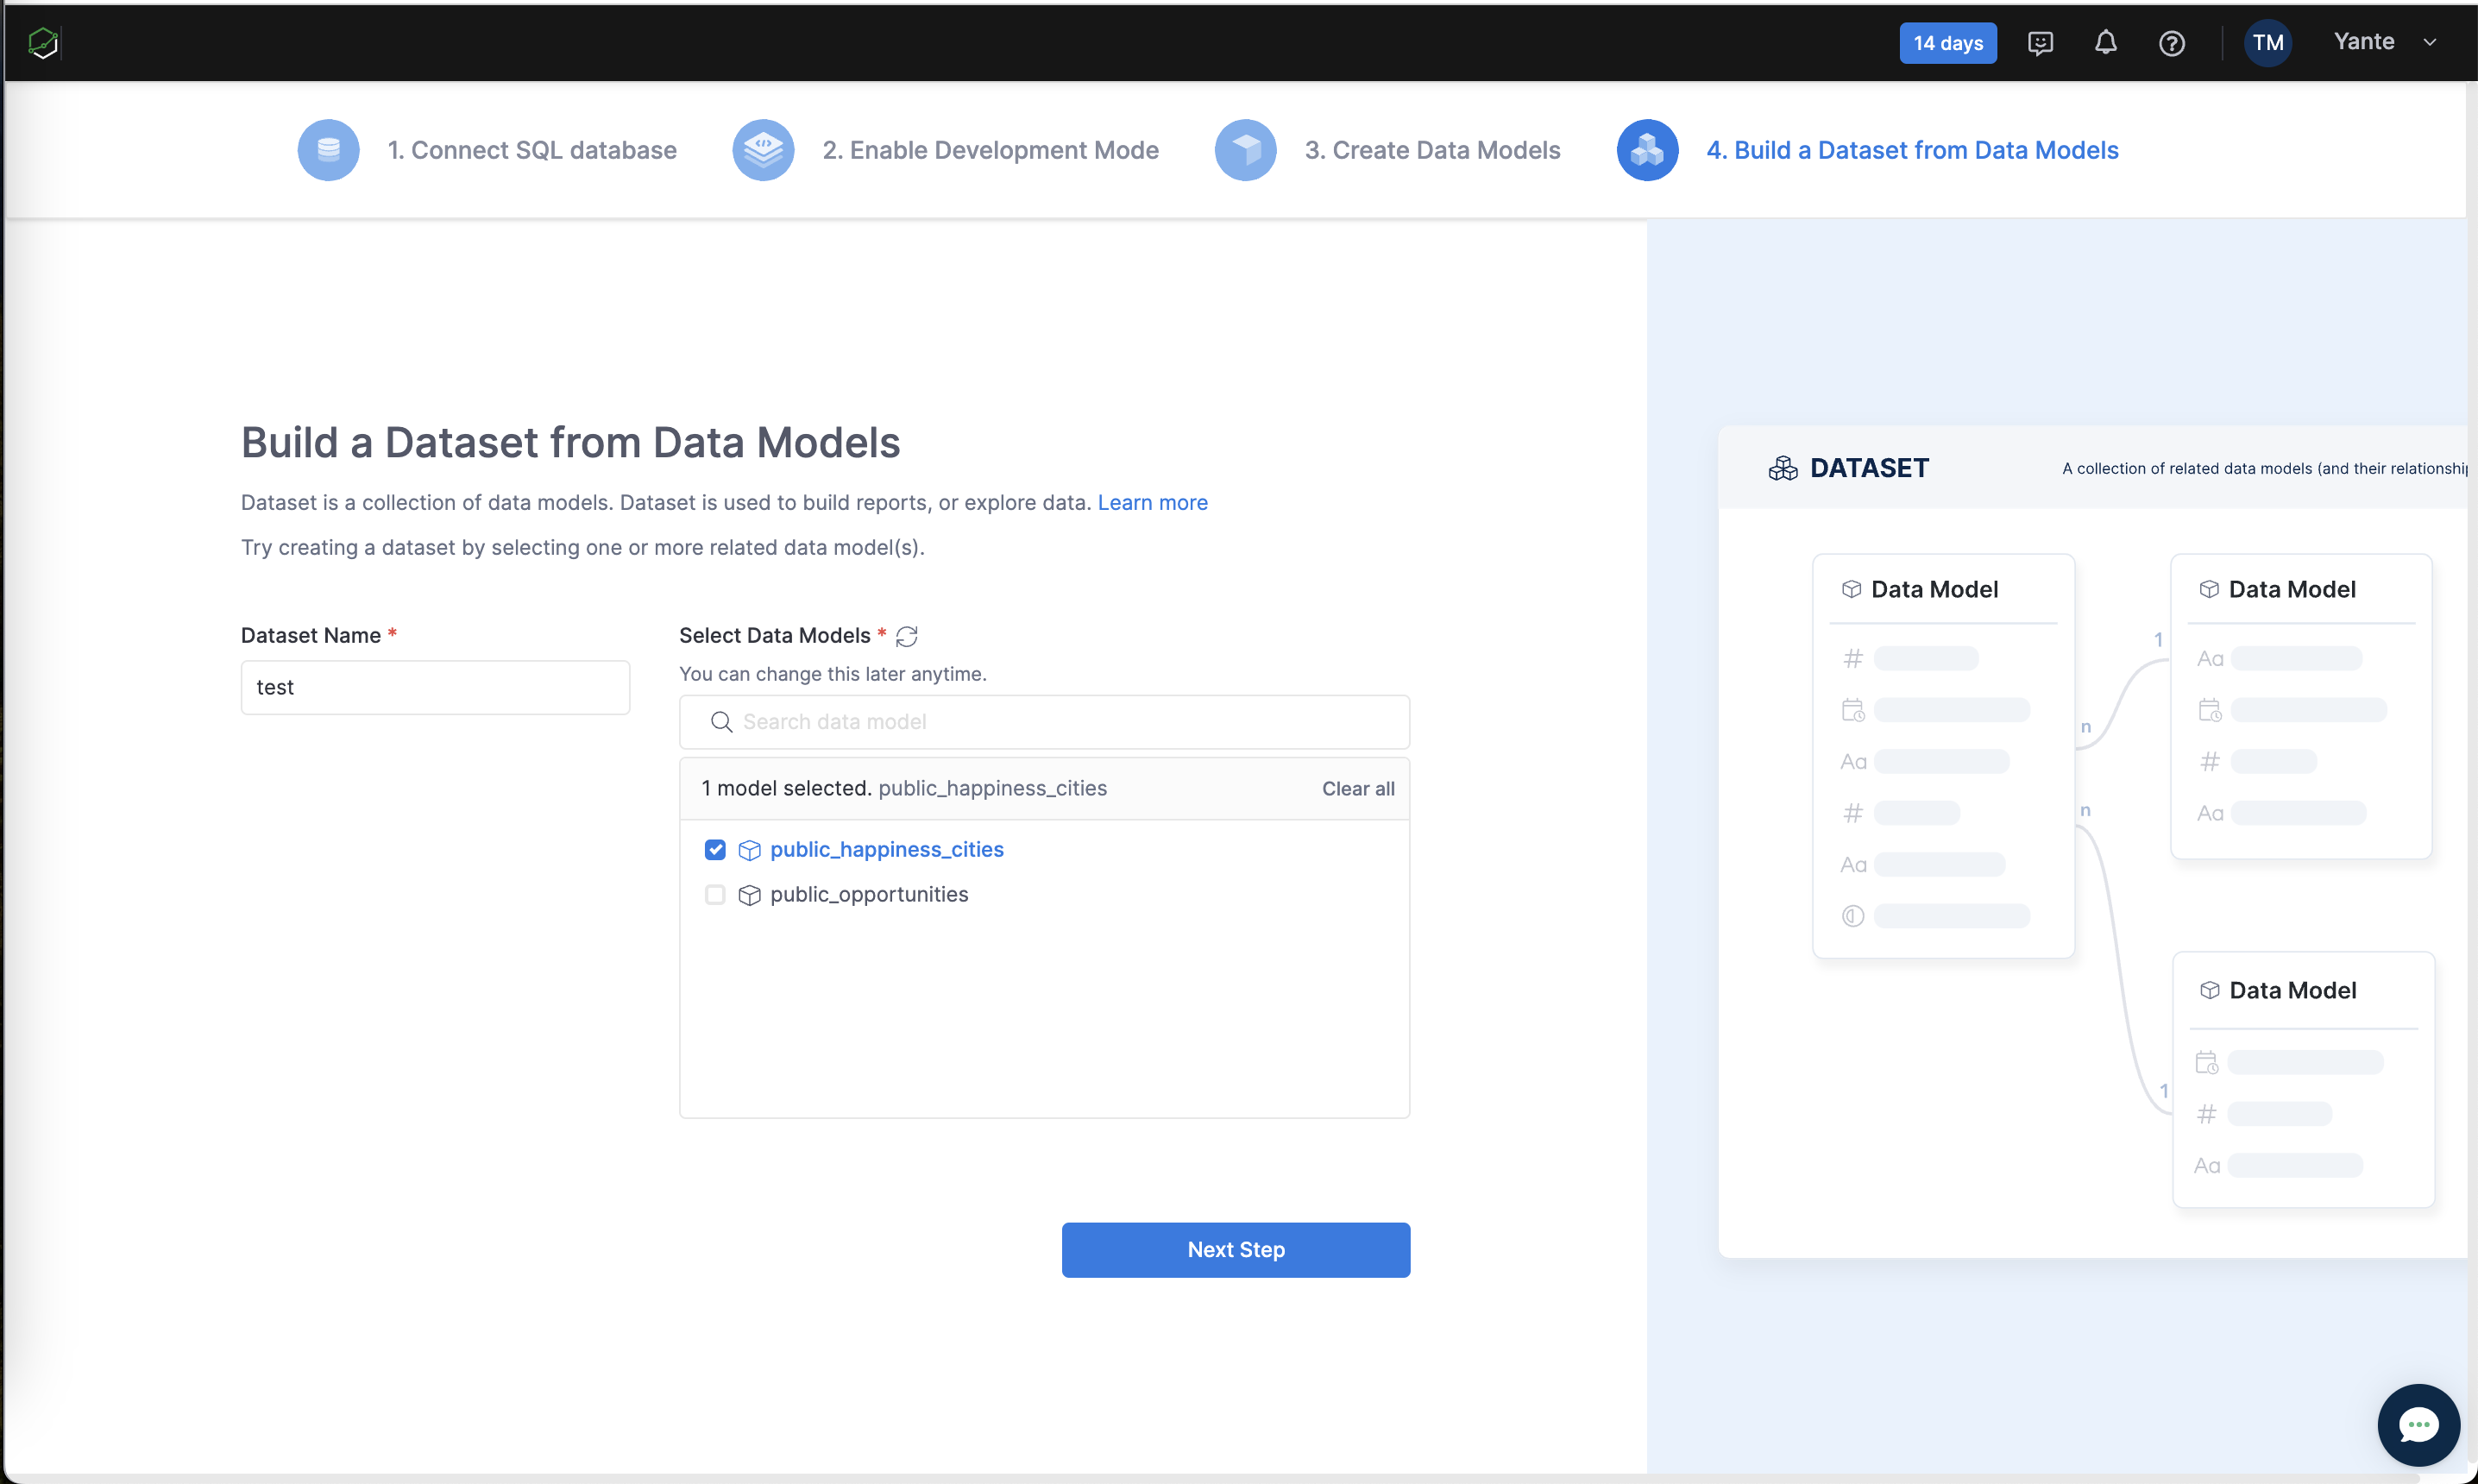
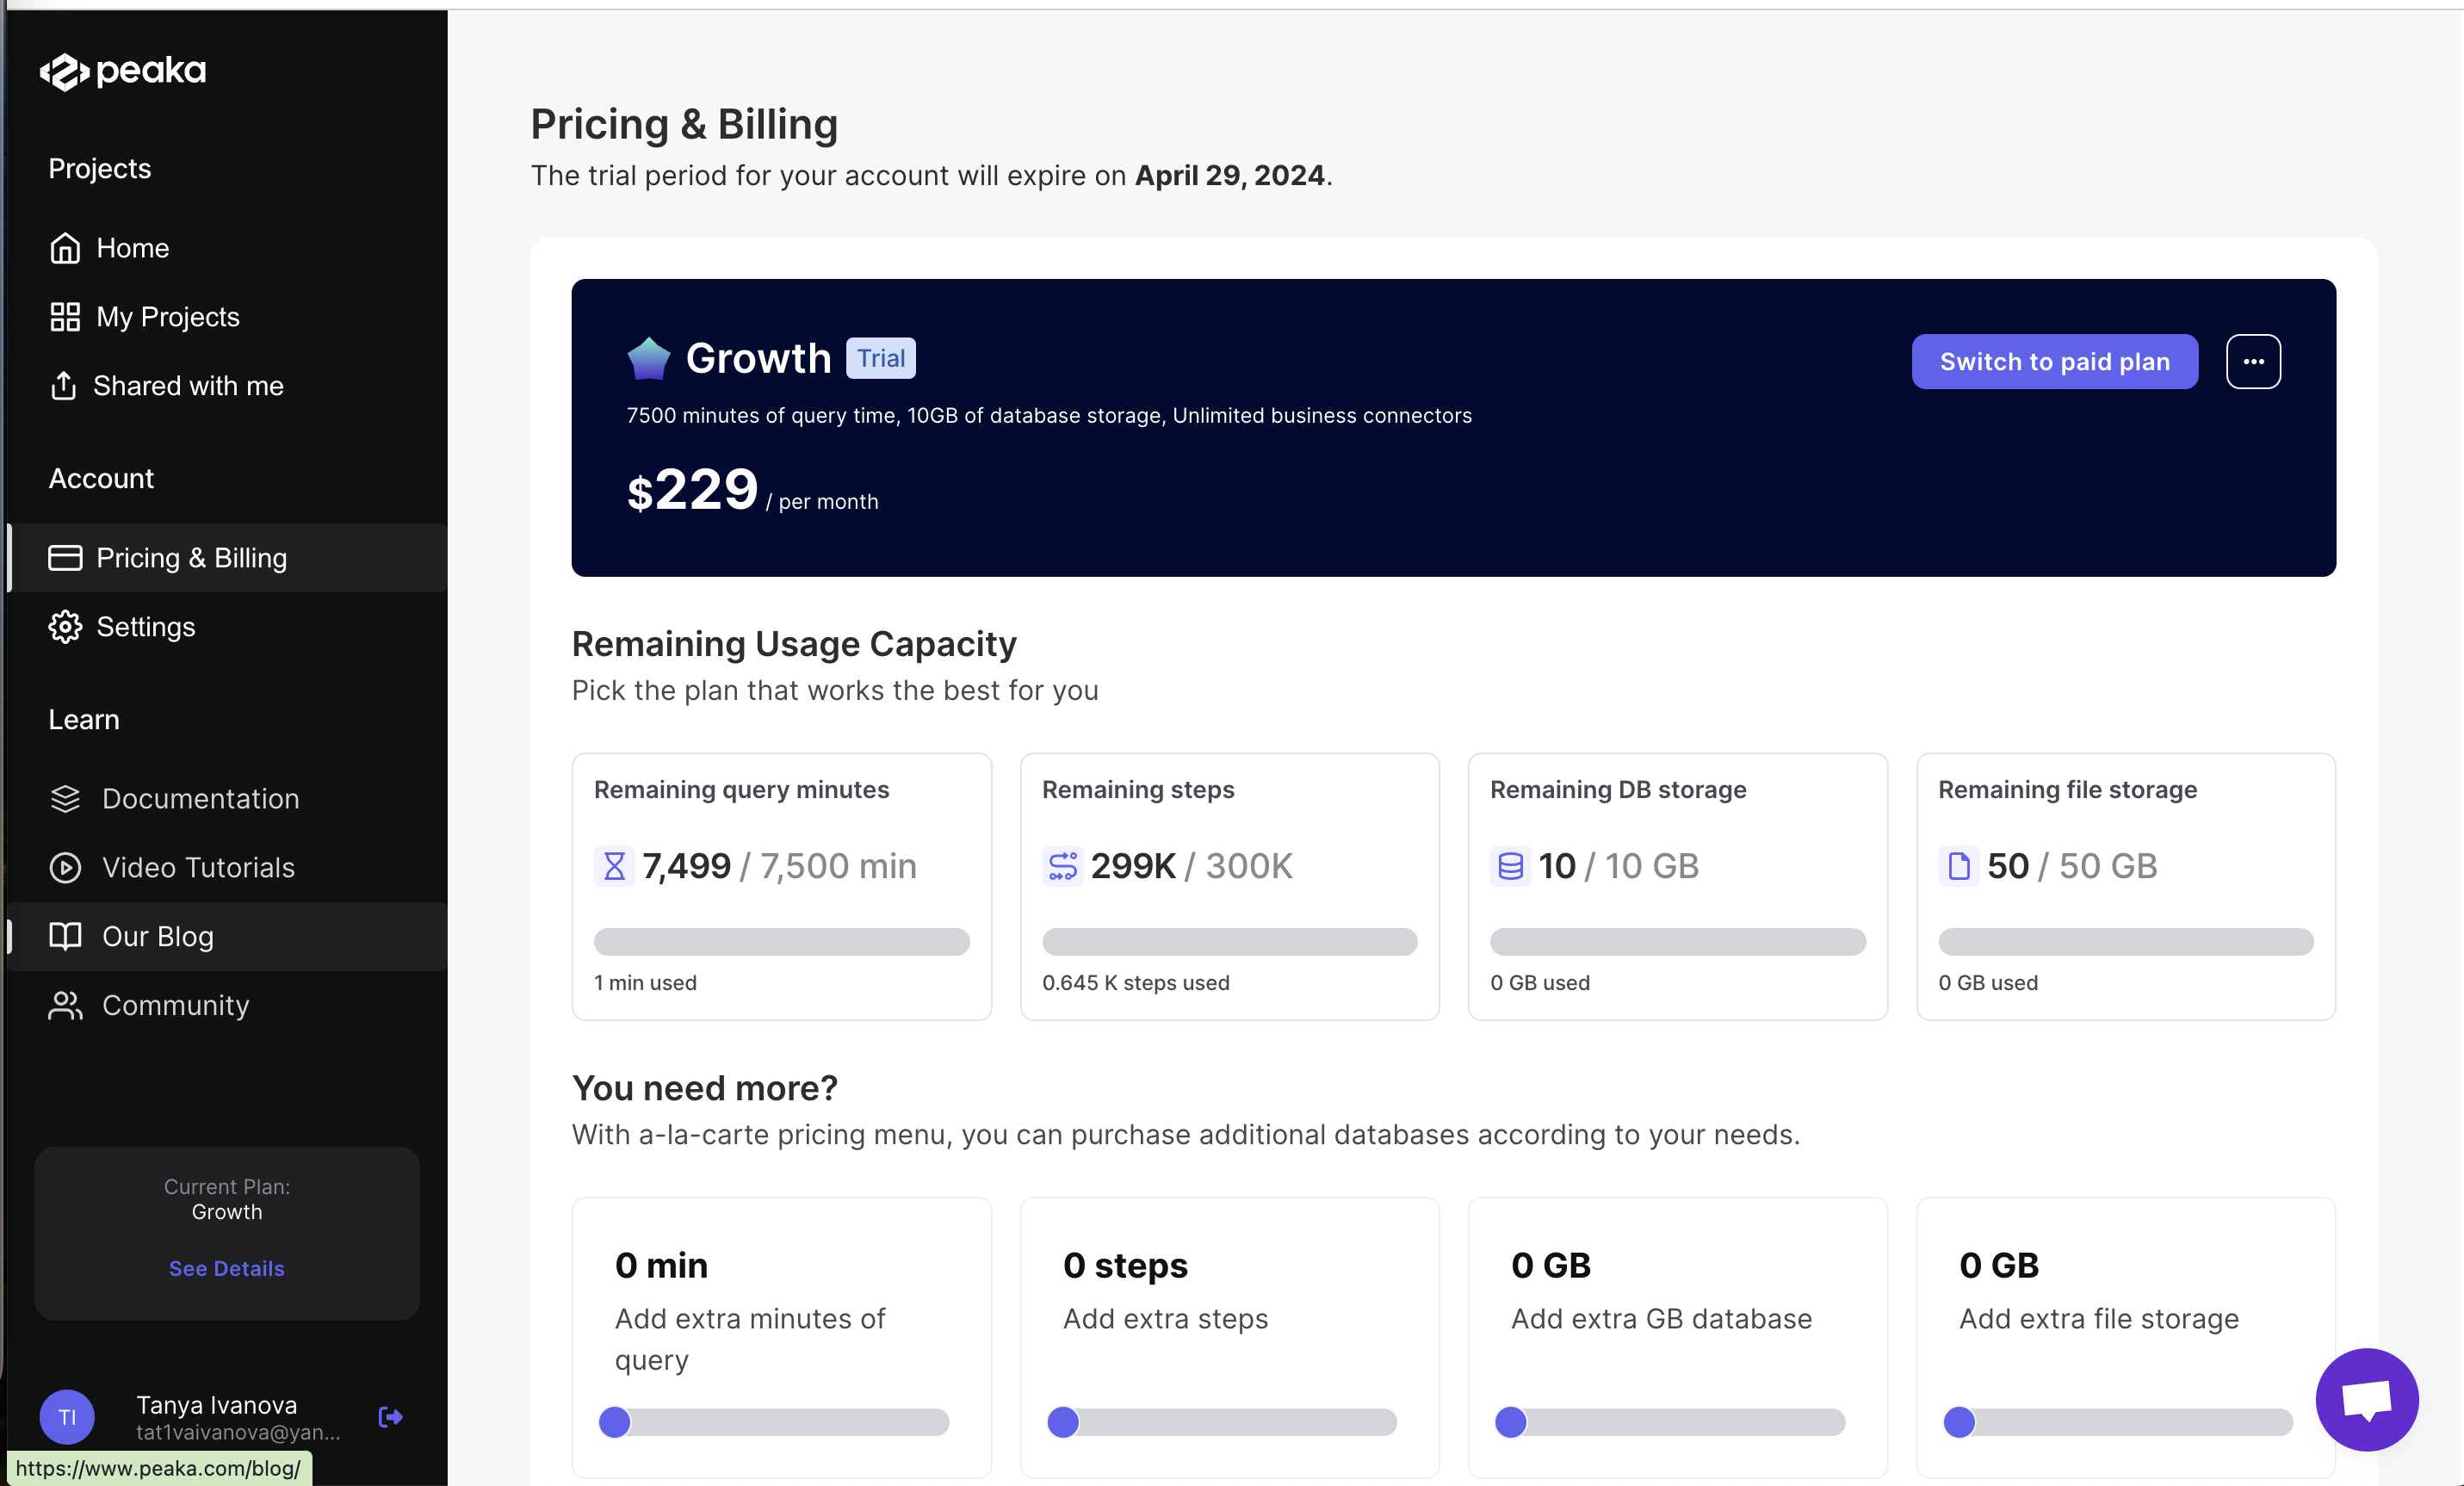
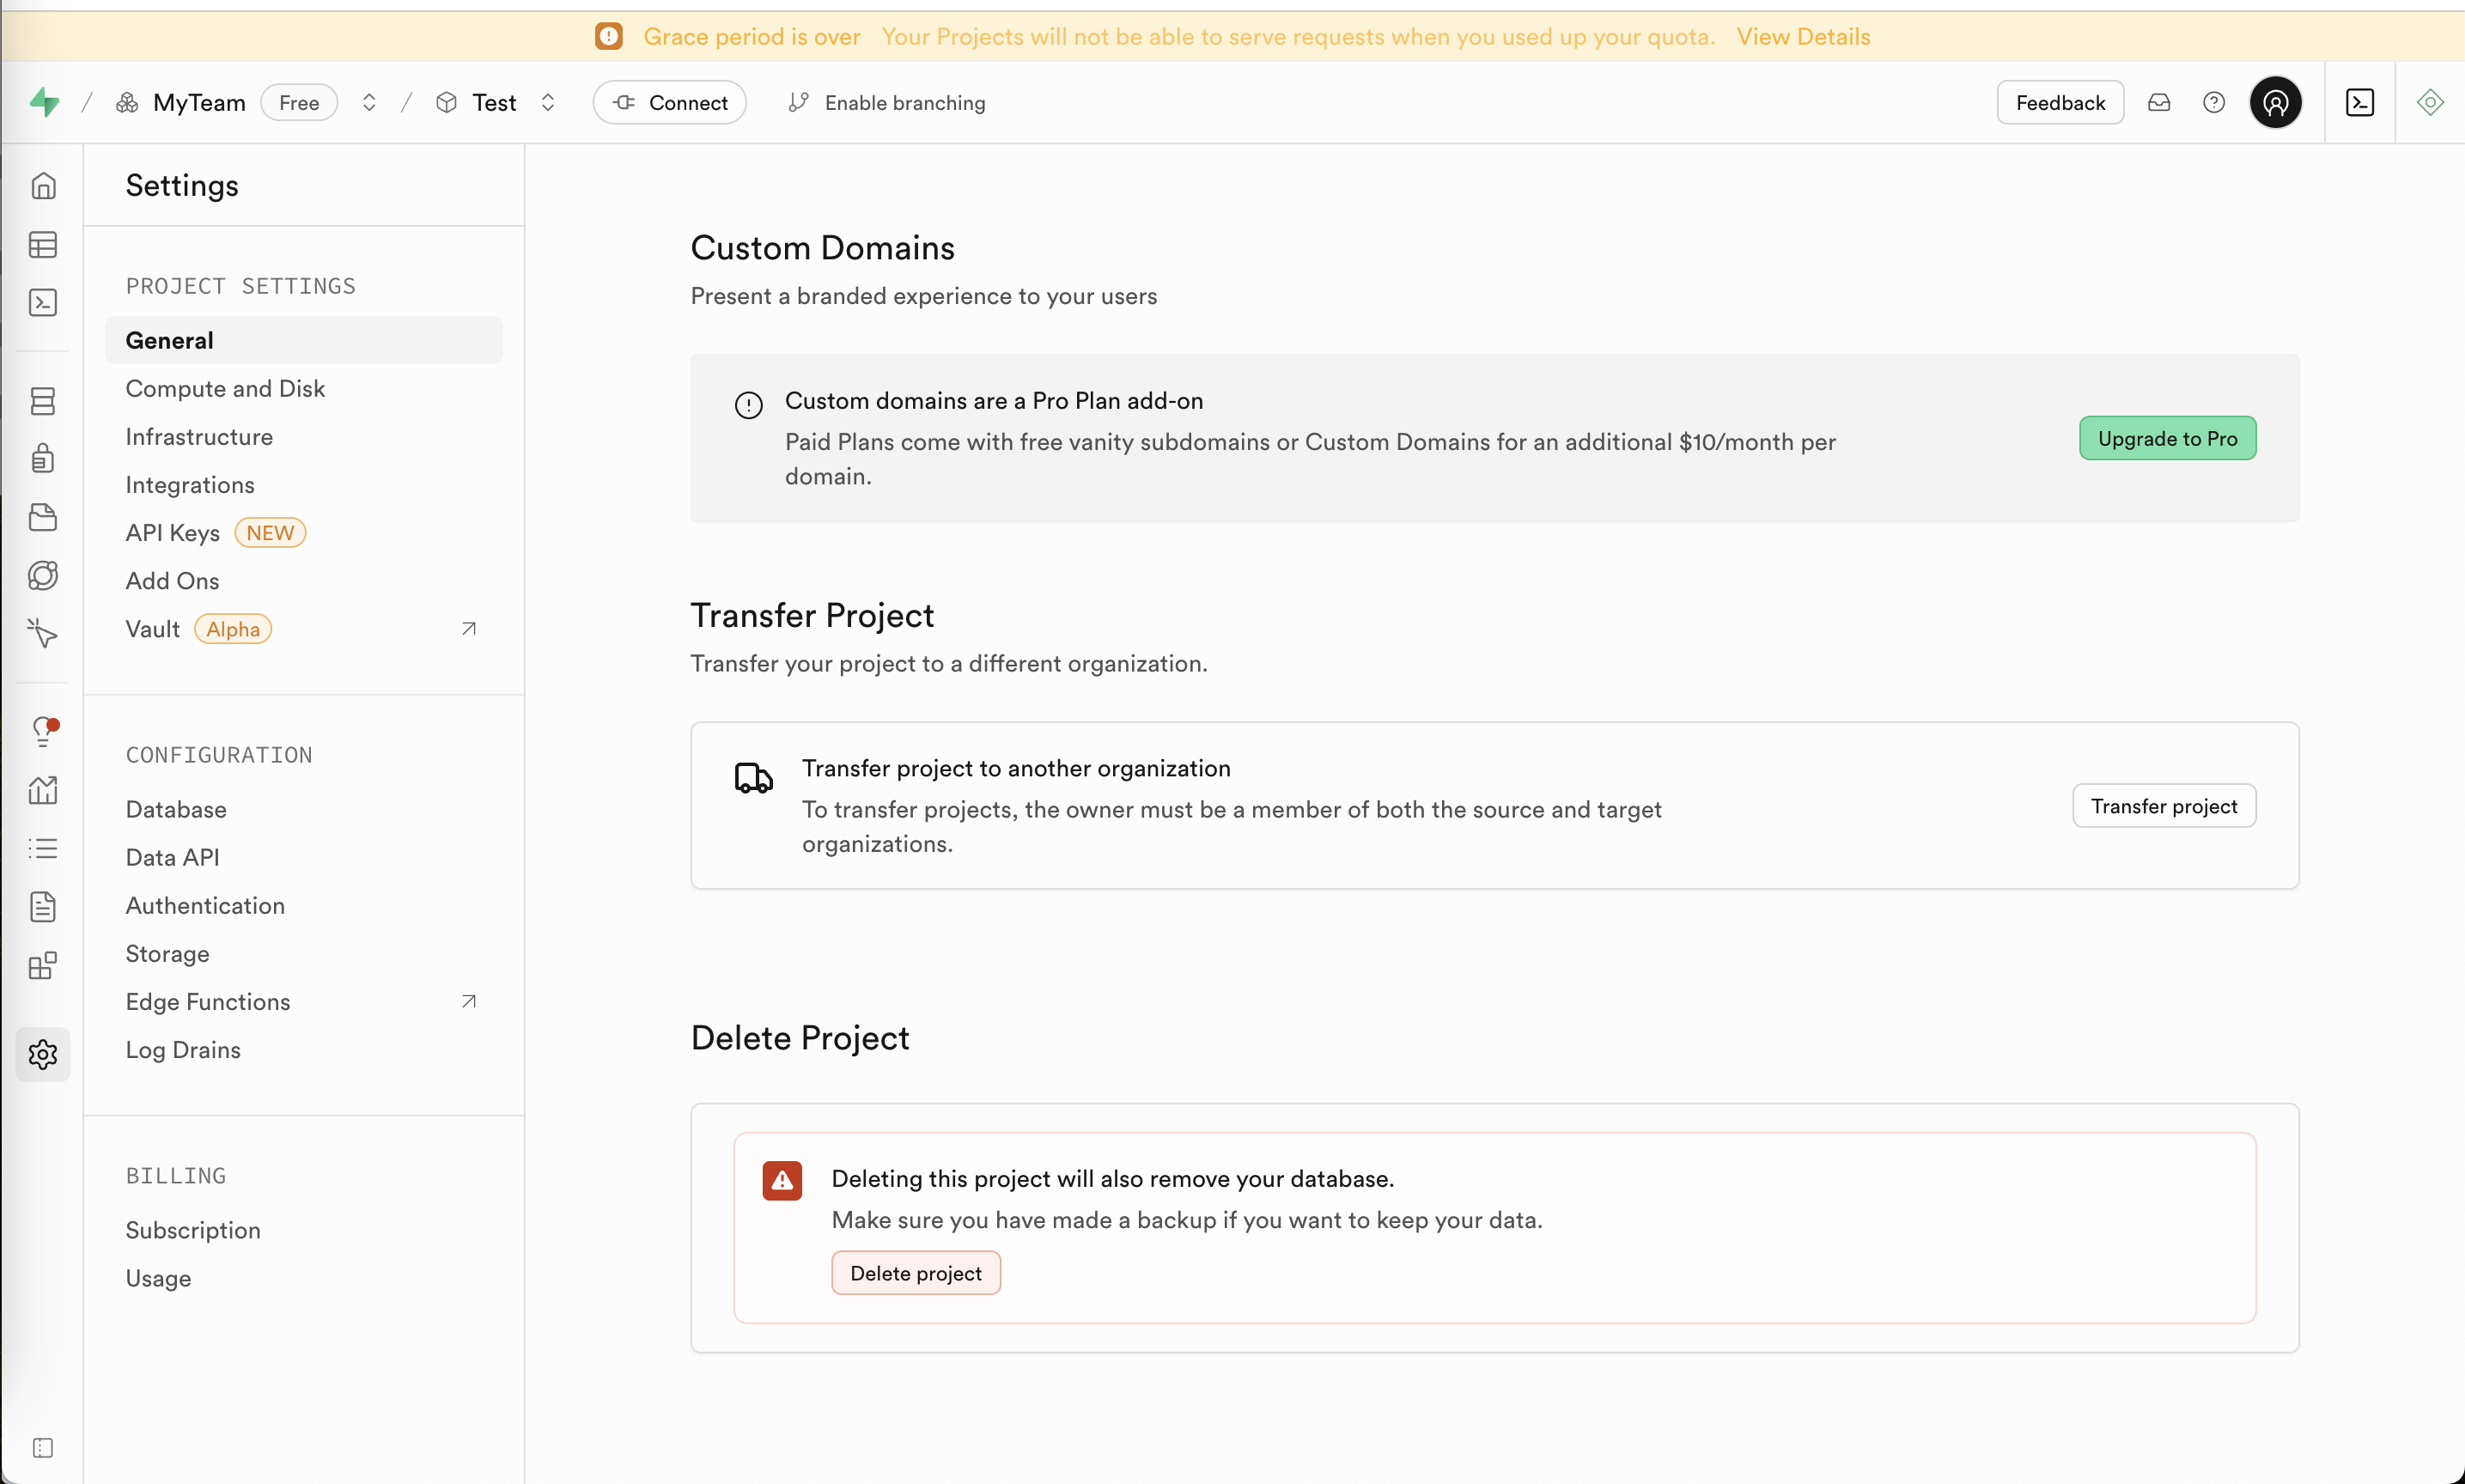
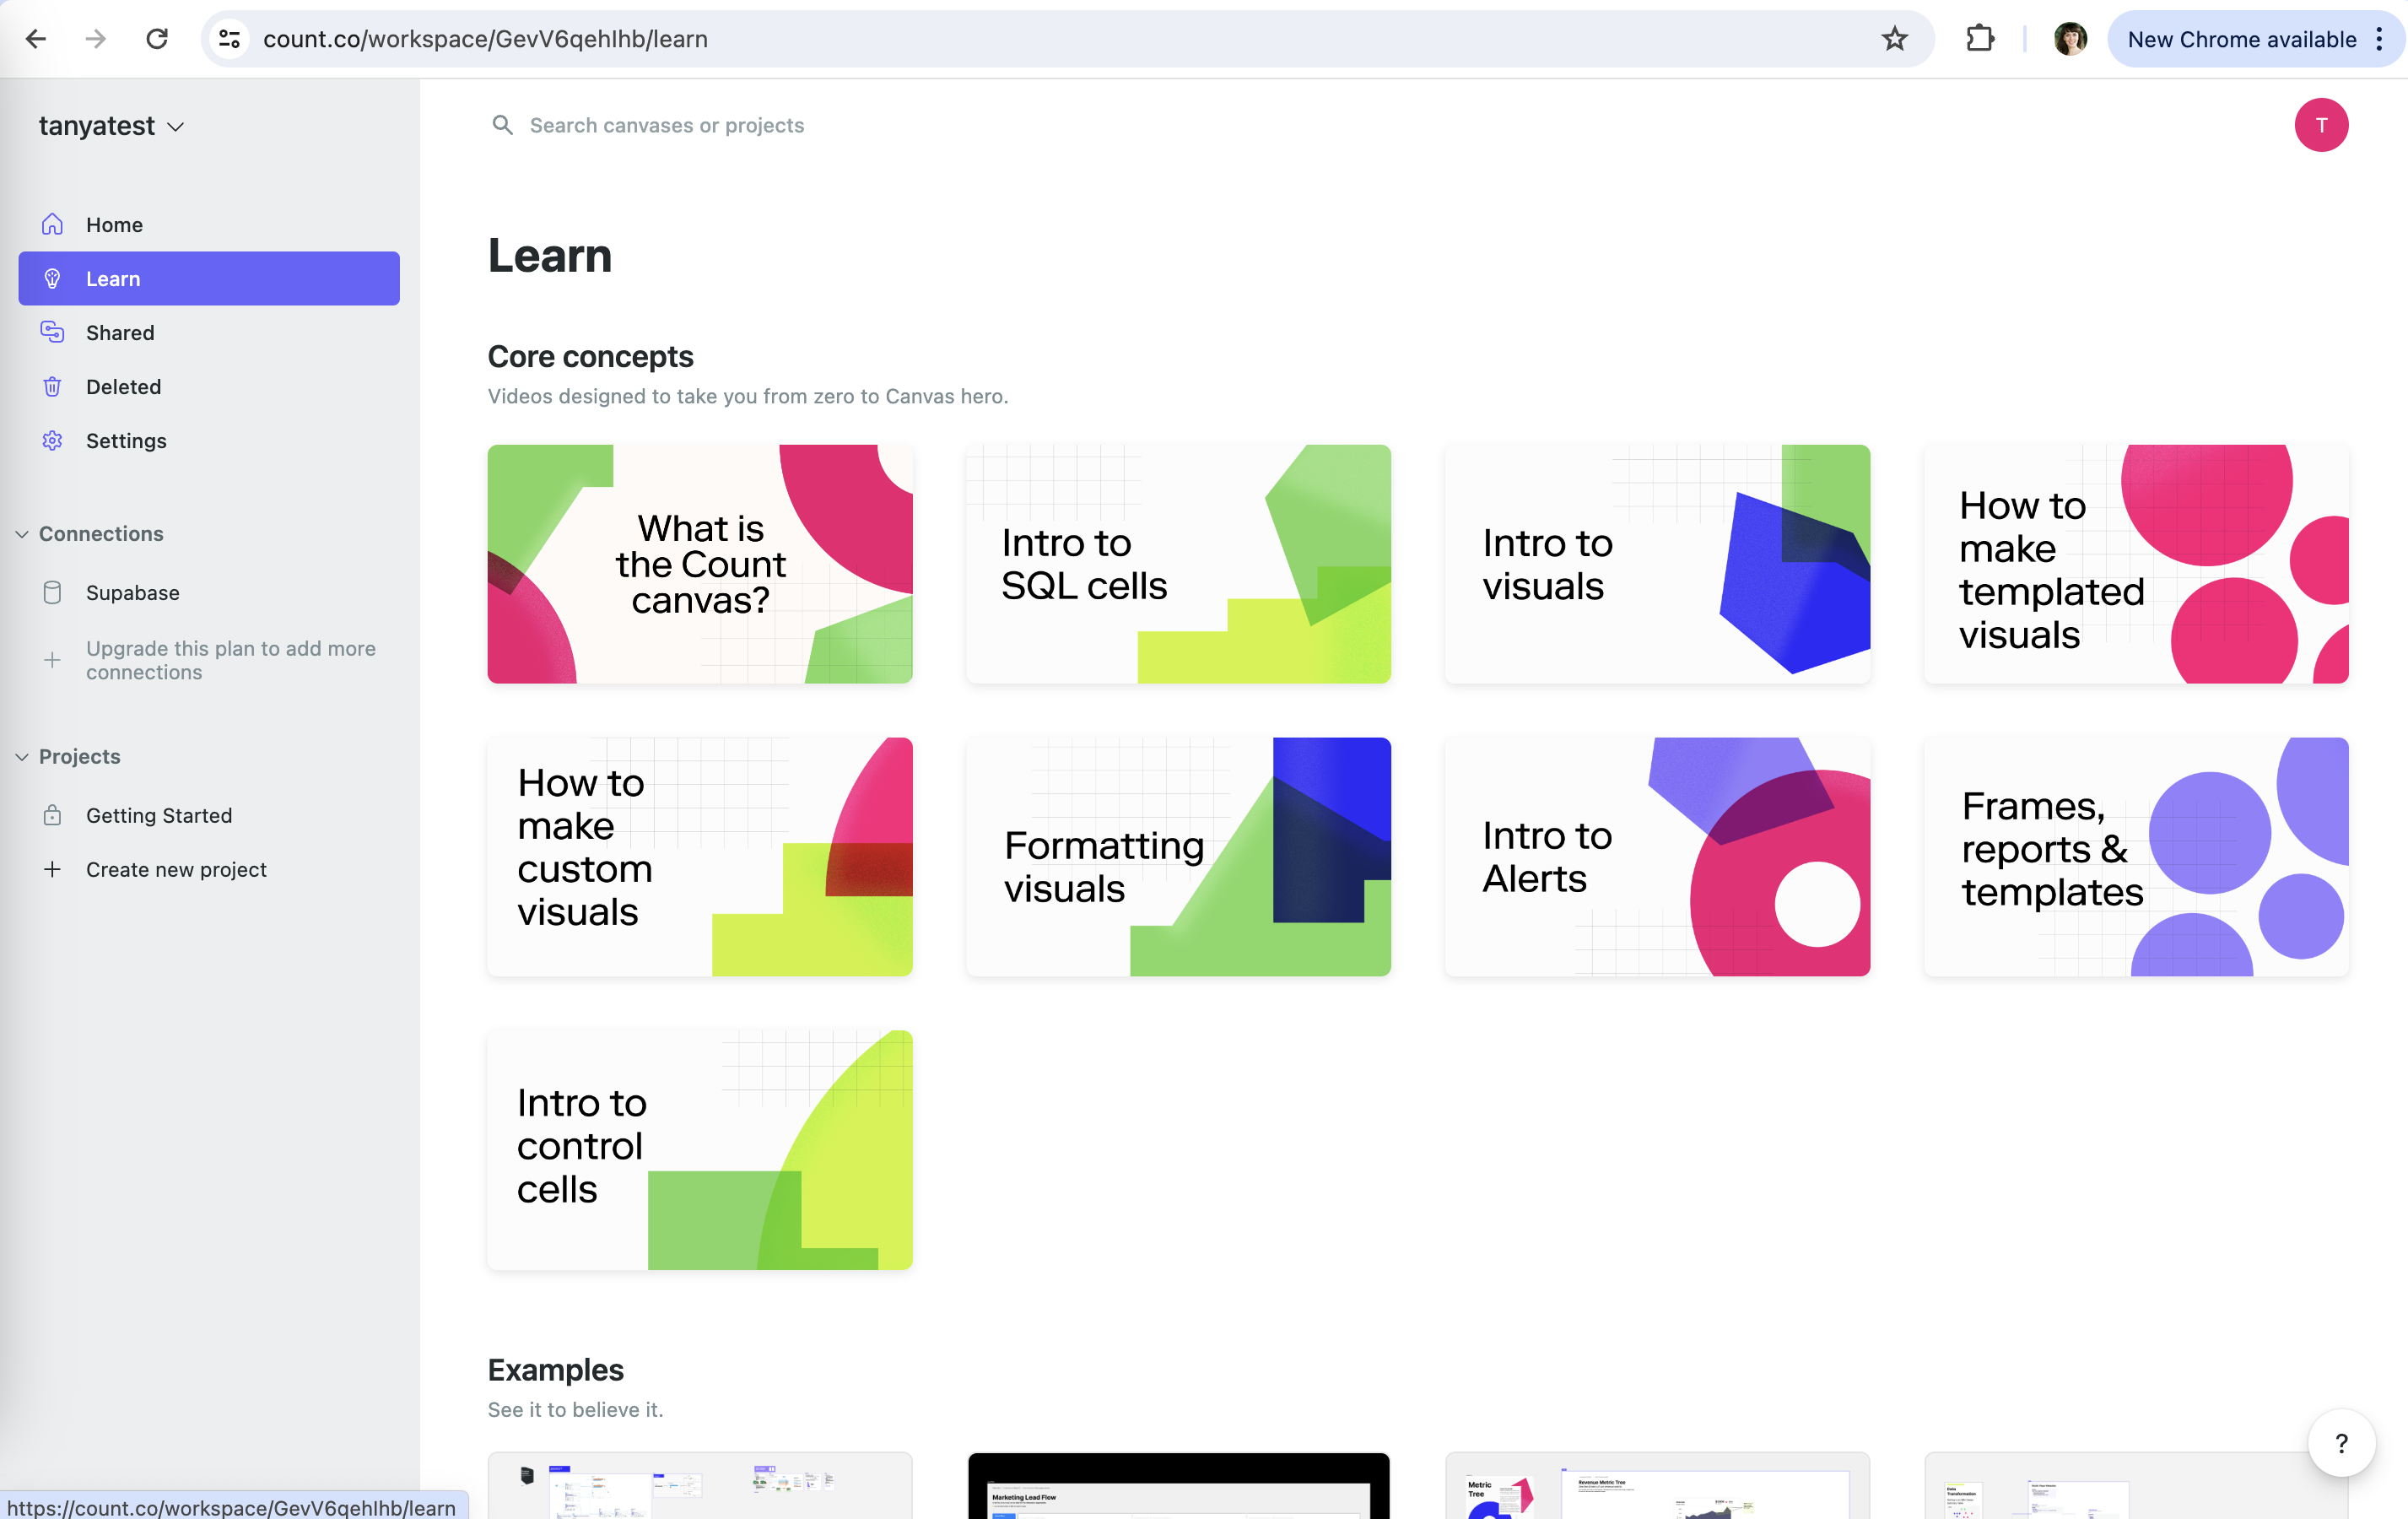
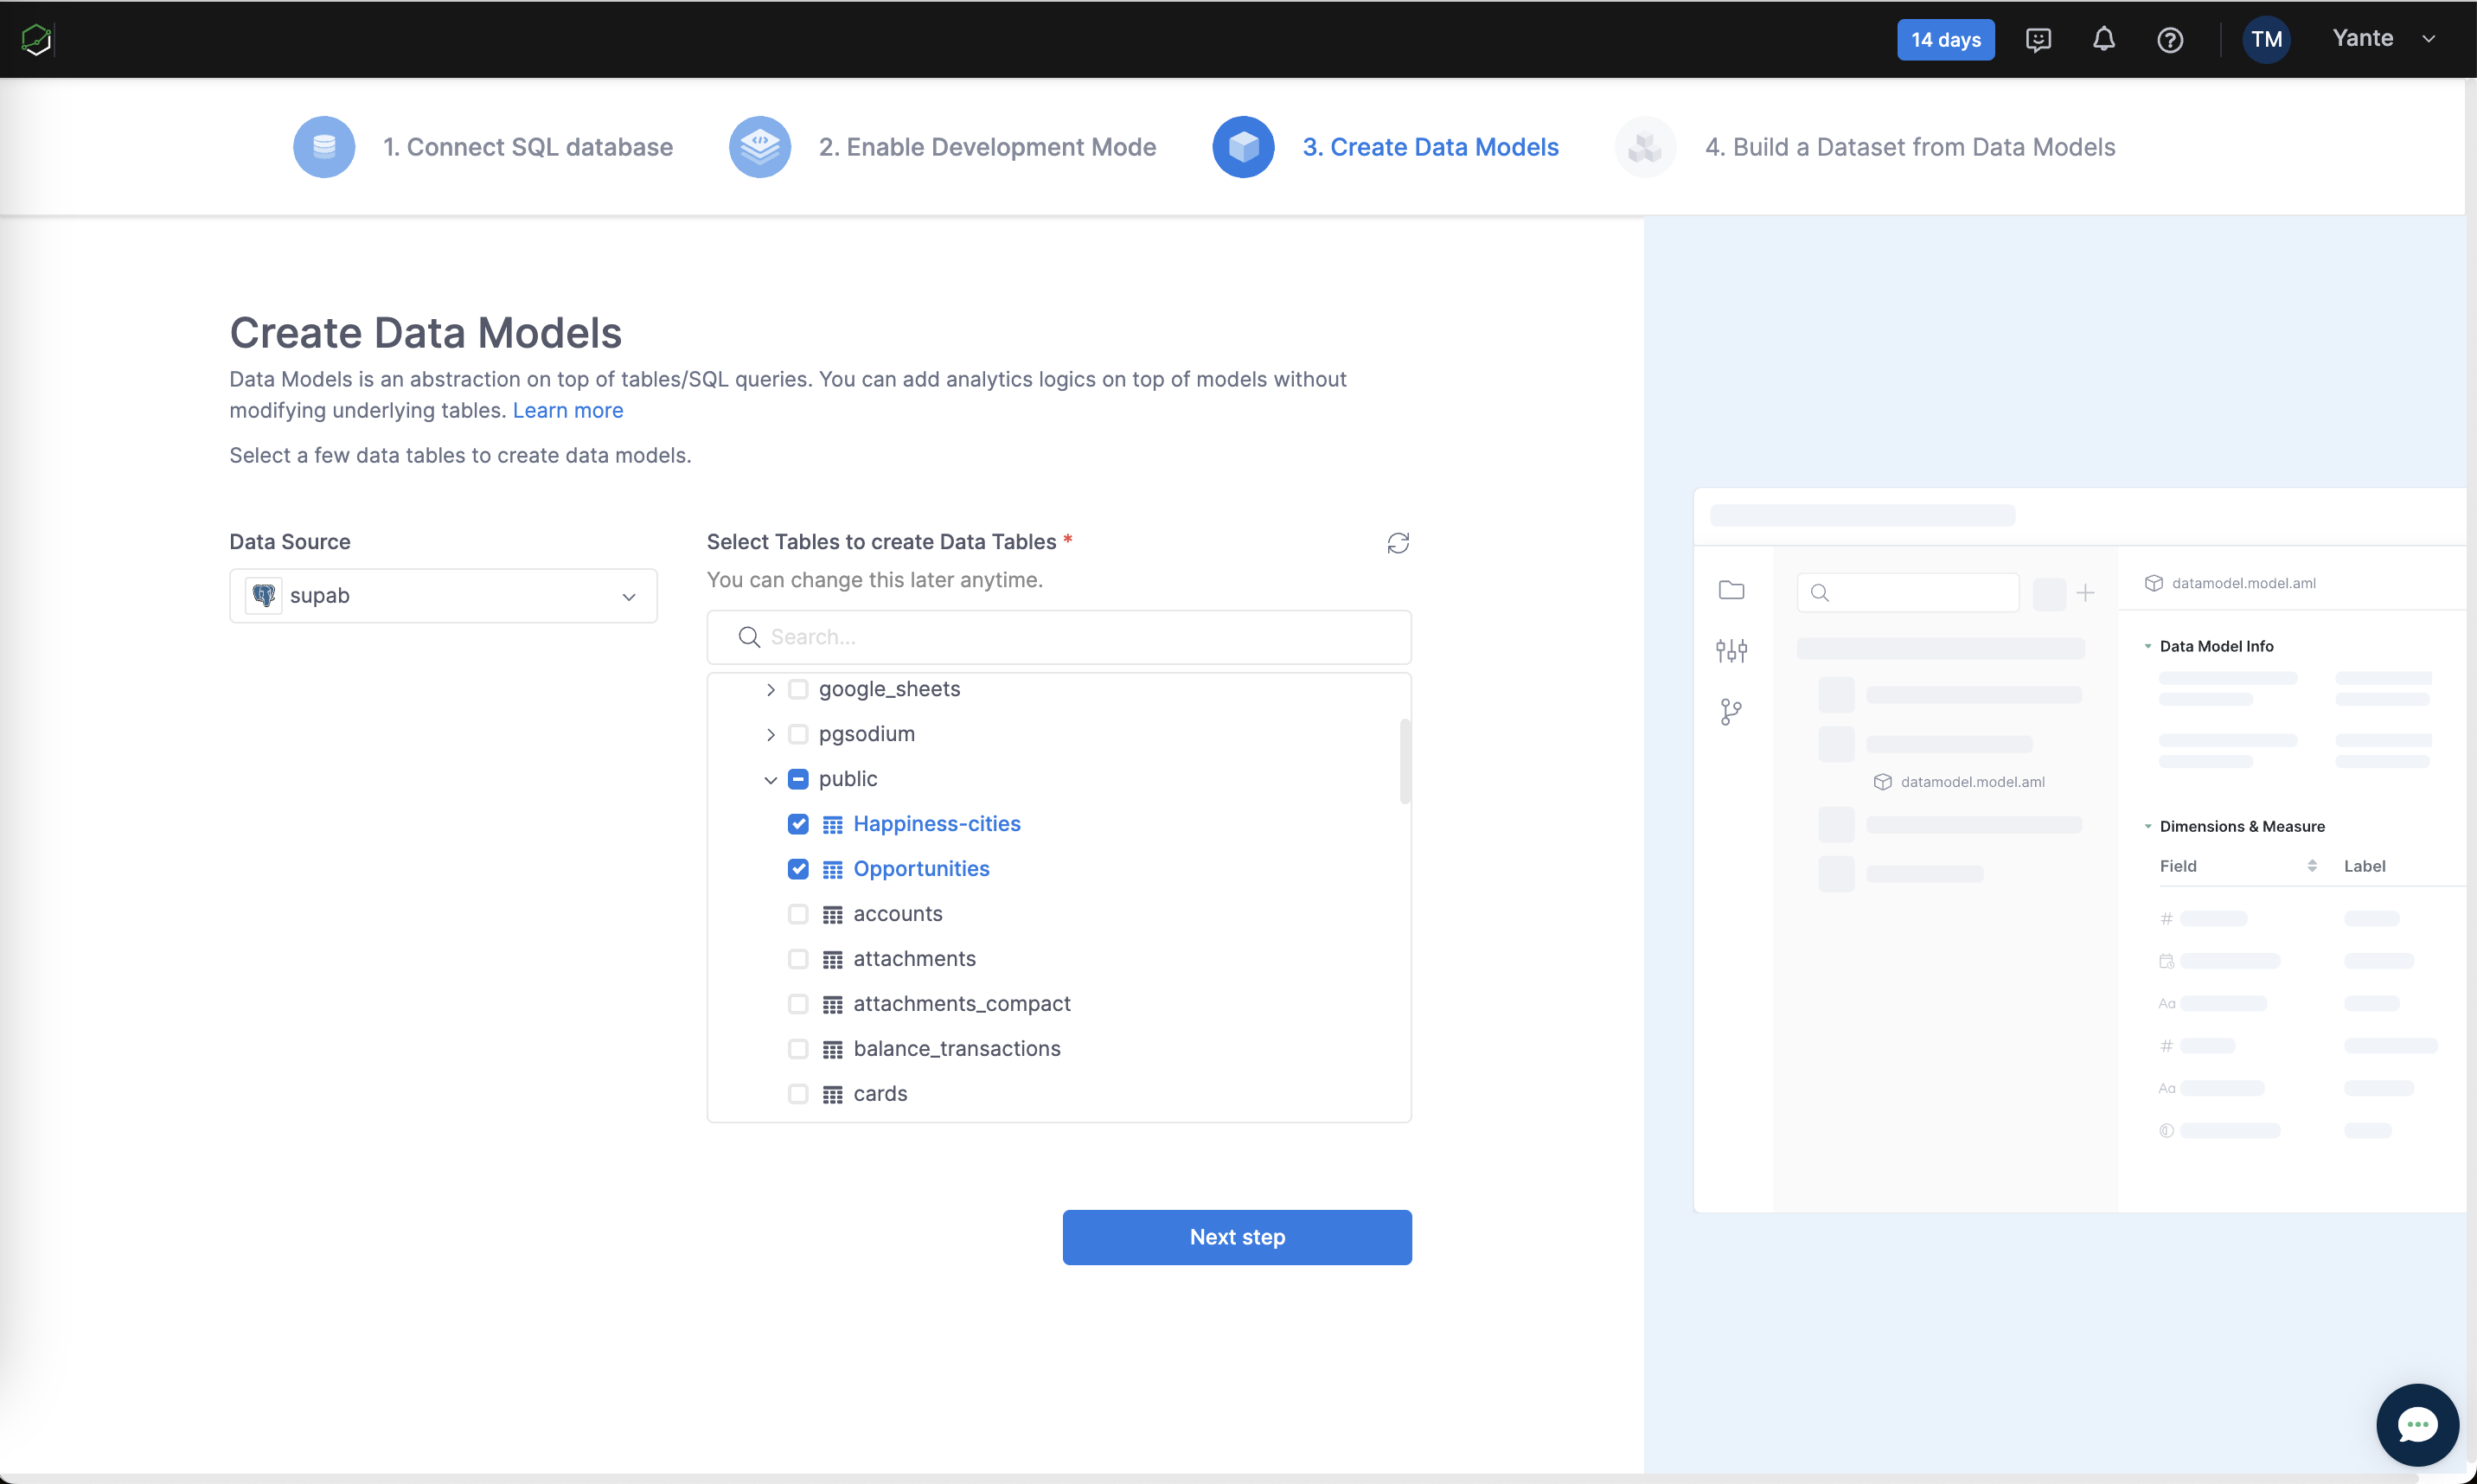
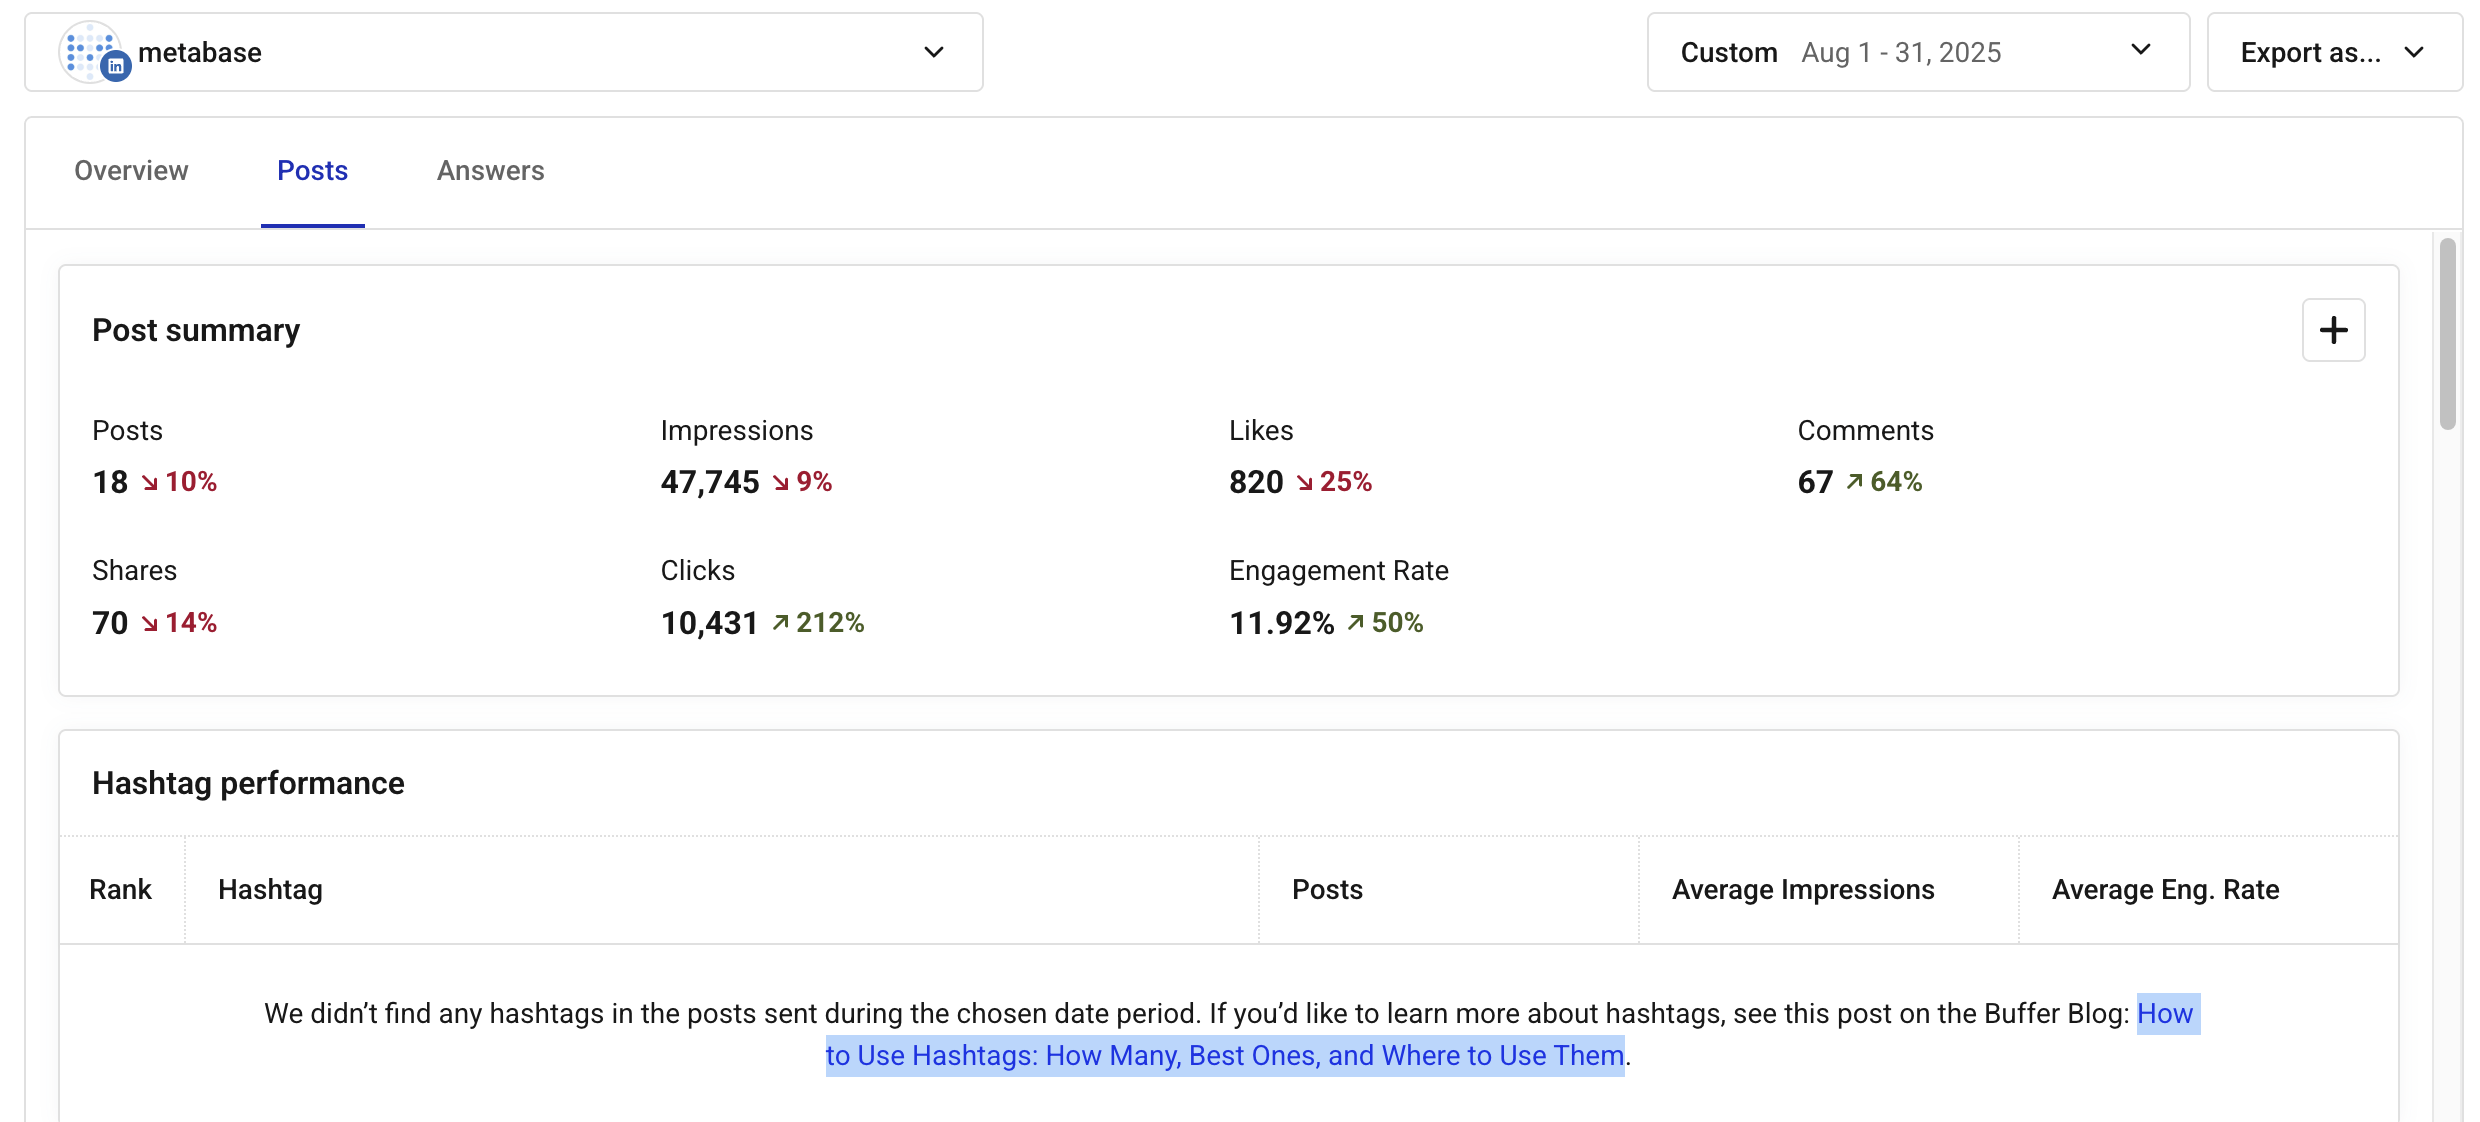
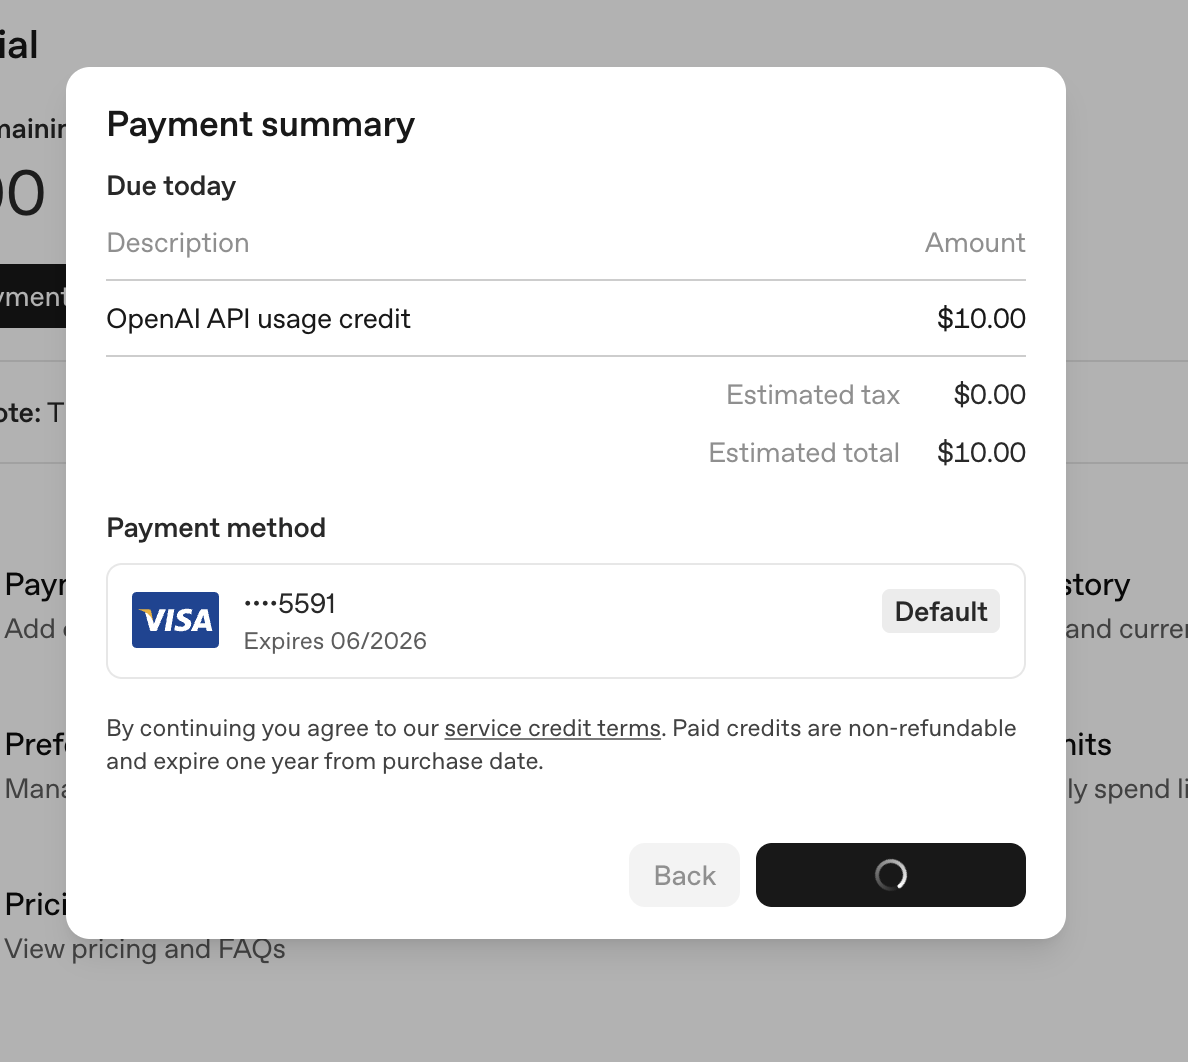
Buffer: Deltas on every metric Buffer (working) Deltas on every metric Each number carries a colored change versus the previous period. OpenAI API: Button shows progress OpenAI API (working) Button shows progress The confirm button turns into a spinner, so there's no double charge from a second click. OpenAI API: Budget as spent vs cap OpenAI API (working) Budget as spent vs cap "$0.00 / $120.00" with the October label shows the period and the ceiling. Cube Cloud: Upgrade always in reach Cube Cloud (working) Upgrade always in reach A highlighted Upgrade item sits at the bottom of the sidebar. Cube Cloud: Deployment is live Cube Cloud (working) Deployment is live "API is ready" and "Build #1" confirm setup worked before the pitch. Bricks: Skeleton of the result Bricks (working) Skeleton of the result Grey charts and tables preview the layout before data arrives. Neon: Usage bar Neon (working) Usage bar The orange bar at 80% makes the remaining headroom visible at a glance. Supabase: Plan is visible Supabase (working) Plan is visible "Free Plan" in green with "Change subscription plan" right below makes the current state obvious. Gamma: What's new nearby Gamma (working) What's new nearby "What's new in Gamma" lets users see that feedback turns into shipped changes. Snowflake: Connected status Snowflake (working) Connected status A quiet "Connected" check on Domo shows what is already set up. Snowflake: Done, not pending Snowflake (working) Done, not pending "Your partner account has been created" confirms the work already happened. Databricks: Says what is happening Databricks (working) Says what is happening "Taking you to dbt Cloud's sign up page" explains the context switch so the new tab is not a surprise. Databricks: Clear success state Databricks (working) Clear success state "Connection succeeded" closes the loop in the tab you started from. Databricks: Specific failure reasons Databricks (working) Specific failure reasons "Missing privileges", "Couldn't sign into dbt Cloud" turn a vague no into a fixable bug report. Databricks: Connected badge Databricks (working) Connected badge "This workspace is connected to the integration" confirms state on return visits. Count: Schema freshness shown Count (working) Schema freshness shown "Last updated on Mar 18, 2024" next to Refresh tells you how stale the table list is. Julius: Plan beside the chat Julius (working) Plan beside the chat The steps stay visible on the right while you work, step 1 highlighted. Julius: Completion state Julius (working) Completion state "All steps completed" with a green check closes the loop. Lightdash: A no becomes a vote Lightdash (working) A no becomes a vote Vote on your warehouse in GitHub issues, so the request is captured. Holistics: Selection summary Holistics (working) Selection summary "1 model selected" with Clear all keeps state visible. Peaka: Remaining capacity meters Peaka (working) Remaining capacity meters Query minutes, steps, DB and file storage, each with "used" below. Supabase: Faint warning banner Supabase (not working) Faint warning banner "Grace period is over" in pale amber on yellow is easy to read past, though it describes a service cutoff. Count: No progress or length Count (not working) No progress or length Nine video cards with no duration or watched state, so you can't track where you are. Holistics: Done steps don't look done Holistics (not working) Done steps don't look done Steps 1 and 2 are faded like future steps, with no checkmark.