From a how-to blog post to an AI dashboard in three steps
Bricks pops a dashboard promo over its Metabase-to-Google-Sheets guide, then gets you from data upload to a generated dashboard with visible progress and a message quota.
Promo over the blog guide
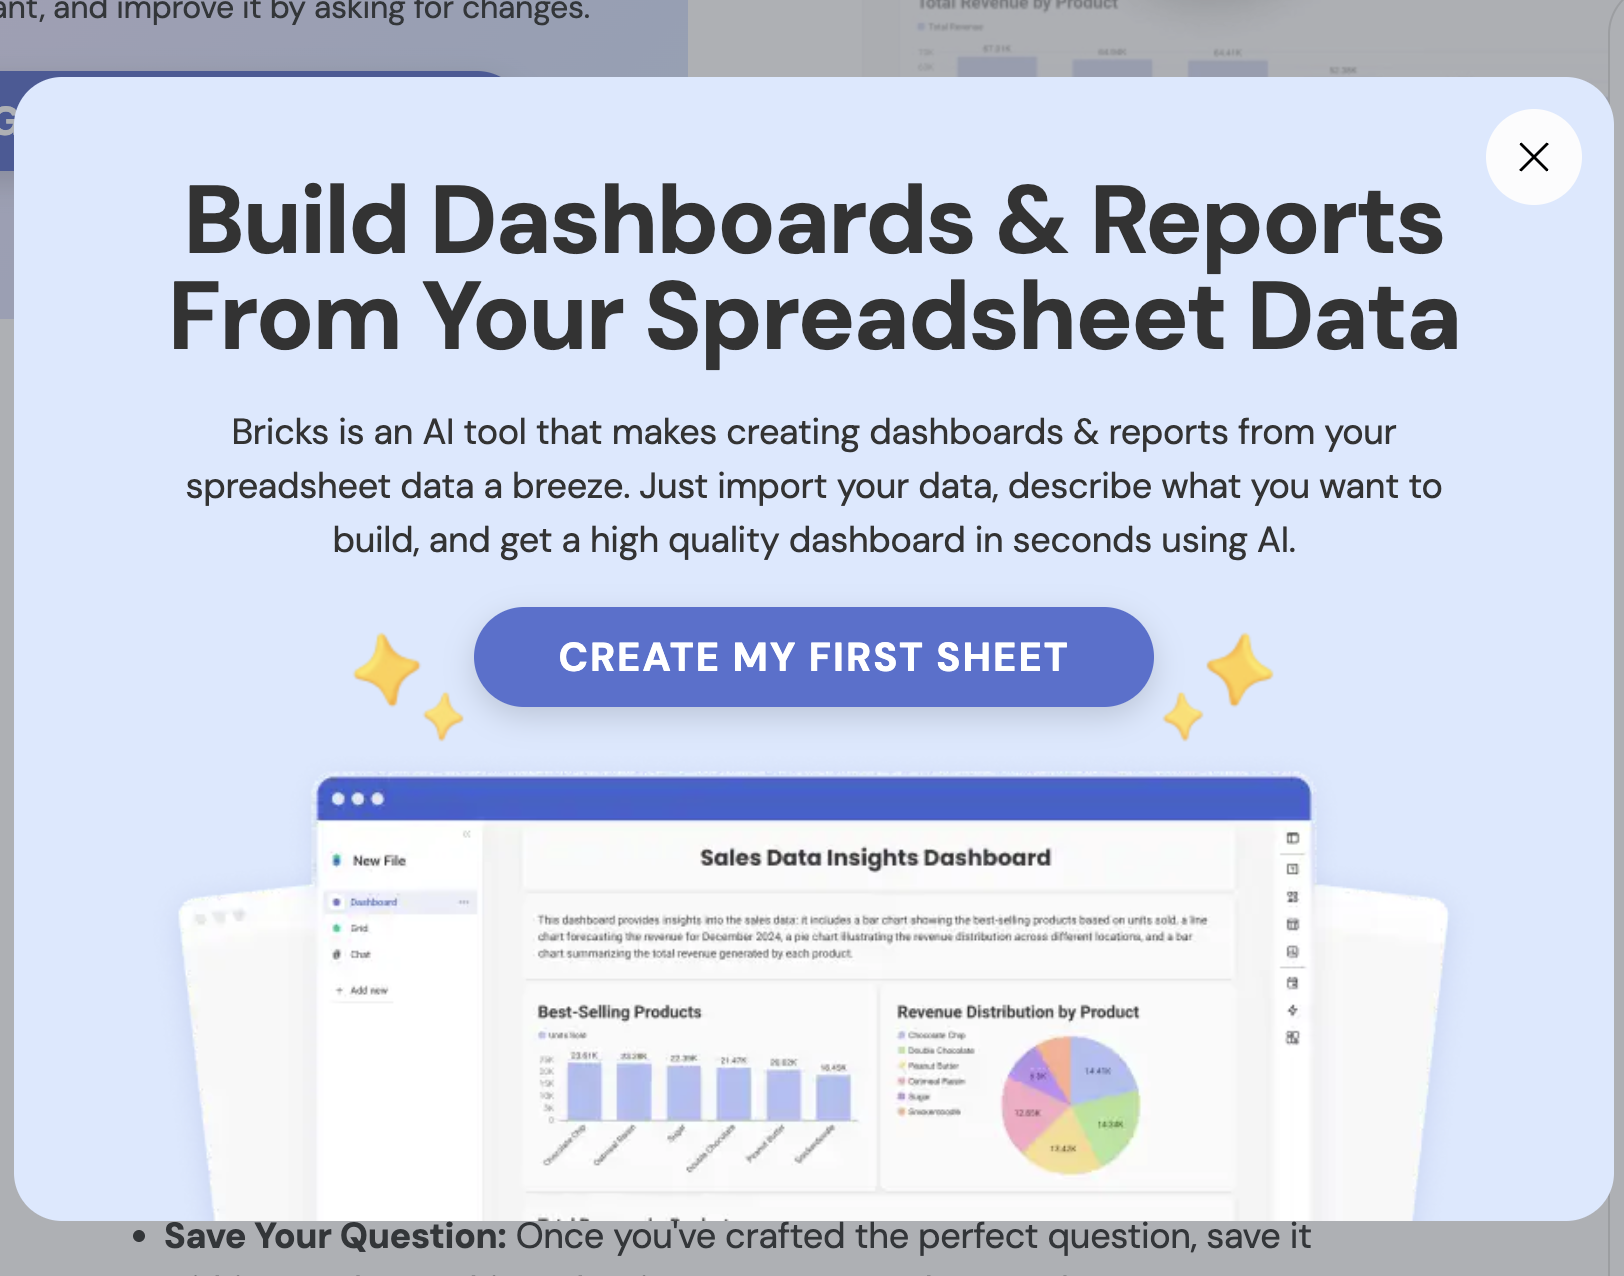
A modal on the SEO article sells dashboards from spreadsheet data, matching what the reader came for.
-
1
Covers the article (not working)
The modal hides the guide the reader is in the middle of.
-
2
Outcome headline (working)
"Build Dashboards & Reports From Your Spreadsheet Data" matches the article's intent.
-
3
How it works in one line (working)
"Import your data, describe what you want, get a dashboard" sets up the three steps.
-
4
First-person CTA (working)
"Create my first sheet" frames the click as starting your own thing.
- 5
Bricks homepage
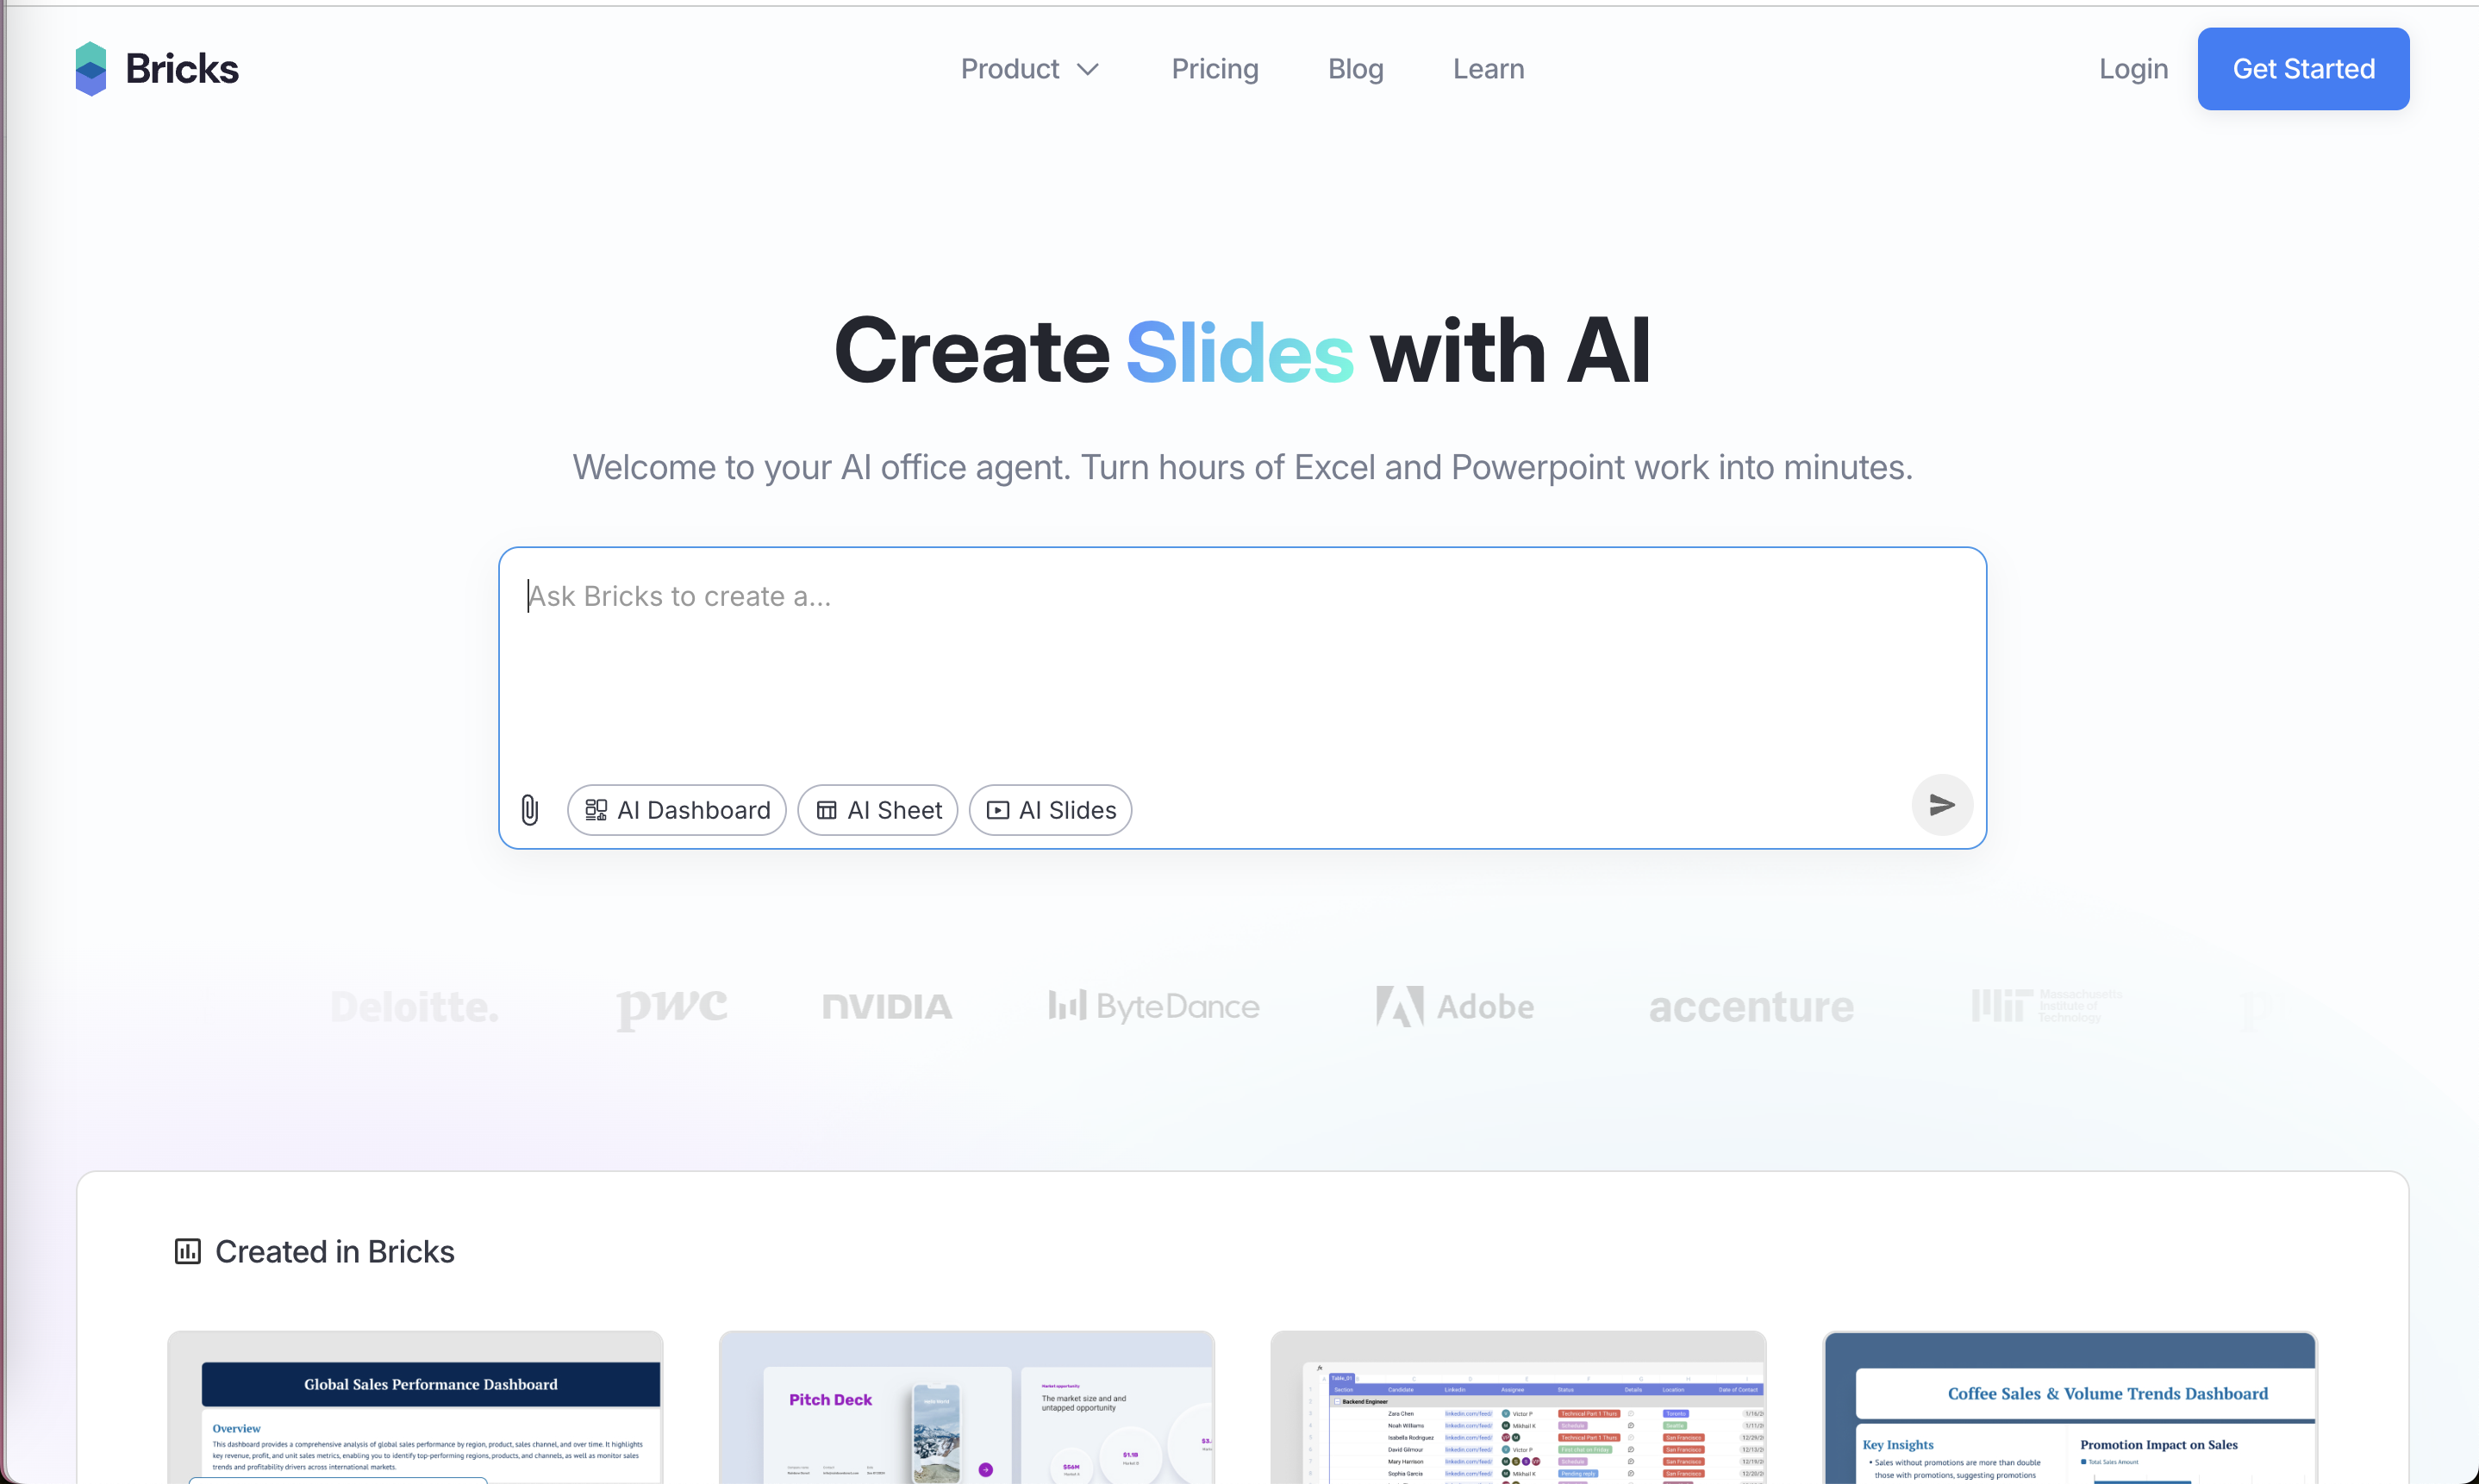
The site's front door leads with a prompt box, output types and examples.
-
6
Headline switched to Slides (not working)
The promo was about dashboards, but the headline here says "Create Slides with AI".
-
7
Prompt before signup (working)
"Ask Bricks to create a..." lets you start the task right away.
-
8
Output types as chips (working)
AI Dashboard, AI Sheet and AI Slides show the range without a menu.
- 9
- 10
Step 1: what to create
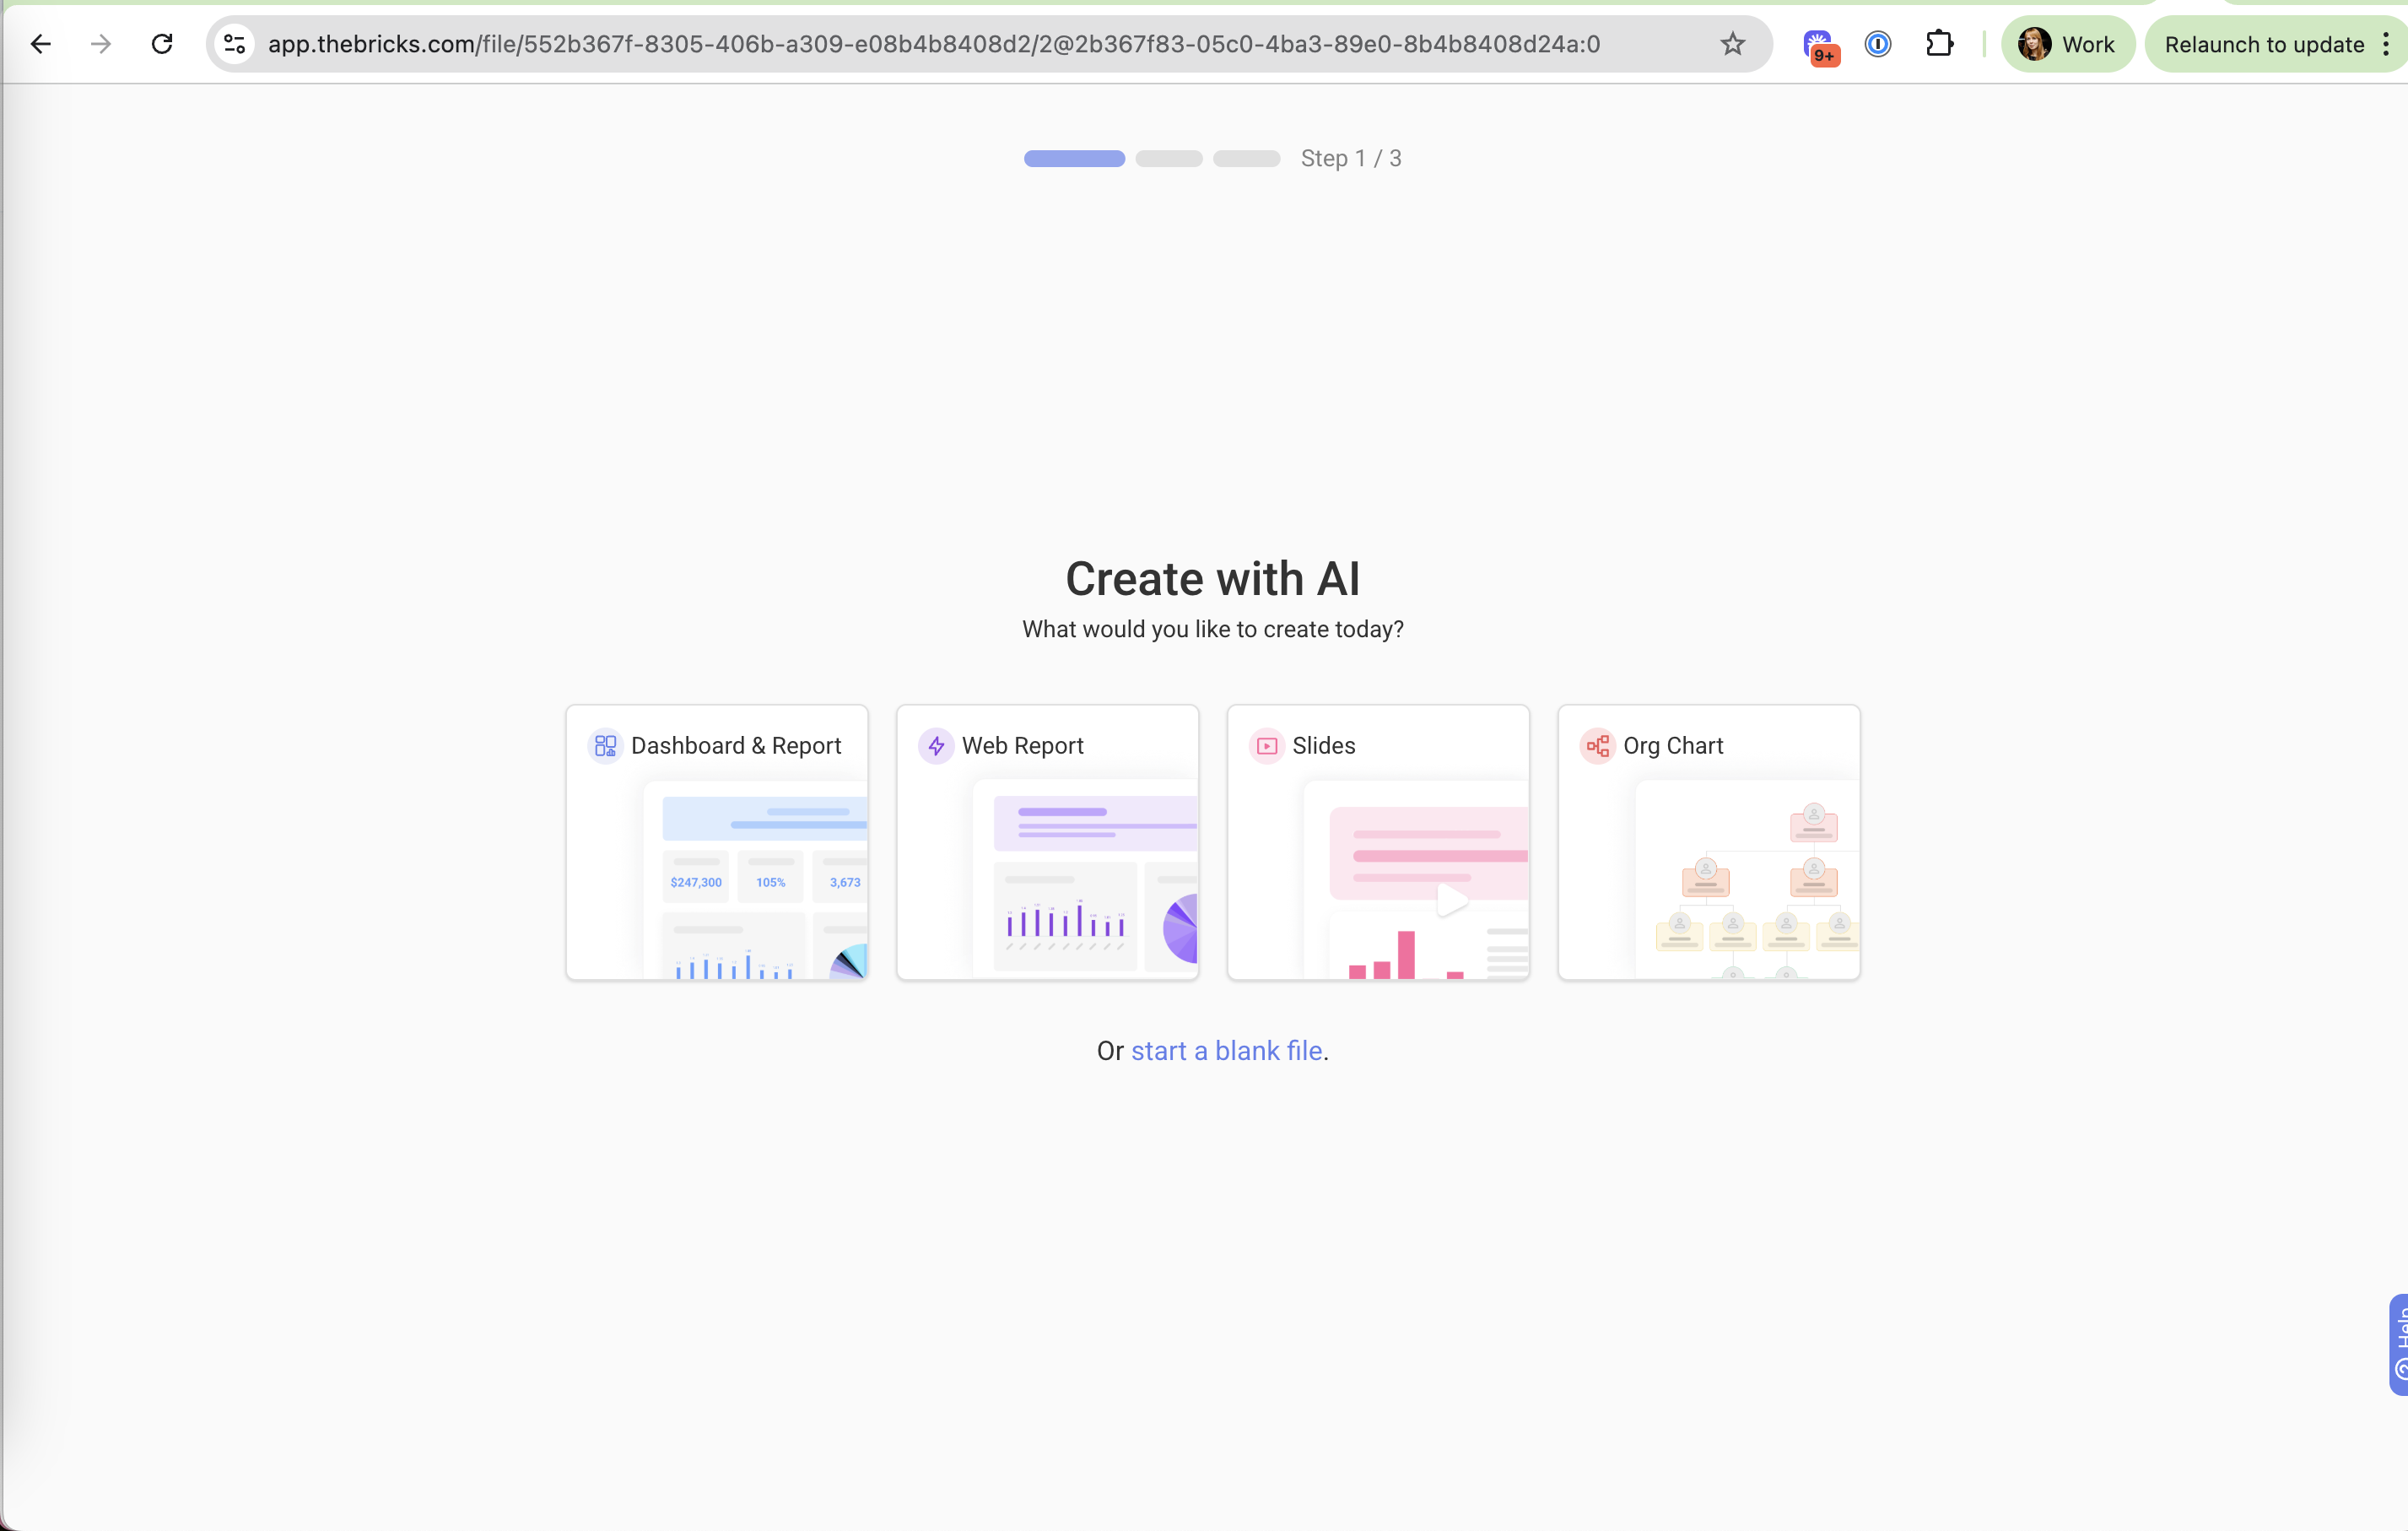
Onboarding asks you to pick an output type from four visual cards.
- 11
-
12
Asks again (not working)
The promo already said dashboards, but you have to pick the type again.
-
13
Cards preview the output (working)
Each option shows a thumbnail of what it makes.
-
14
Blank file fallback (working)
"Or start a blank file" for people who don't want the AI path.
Step 2: add your data
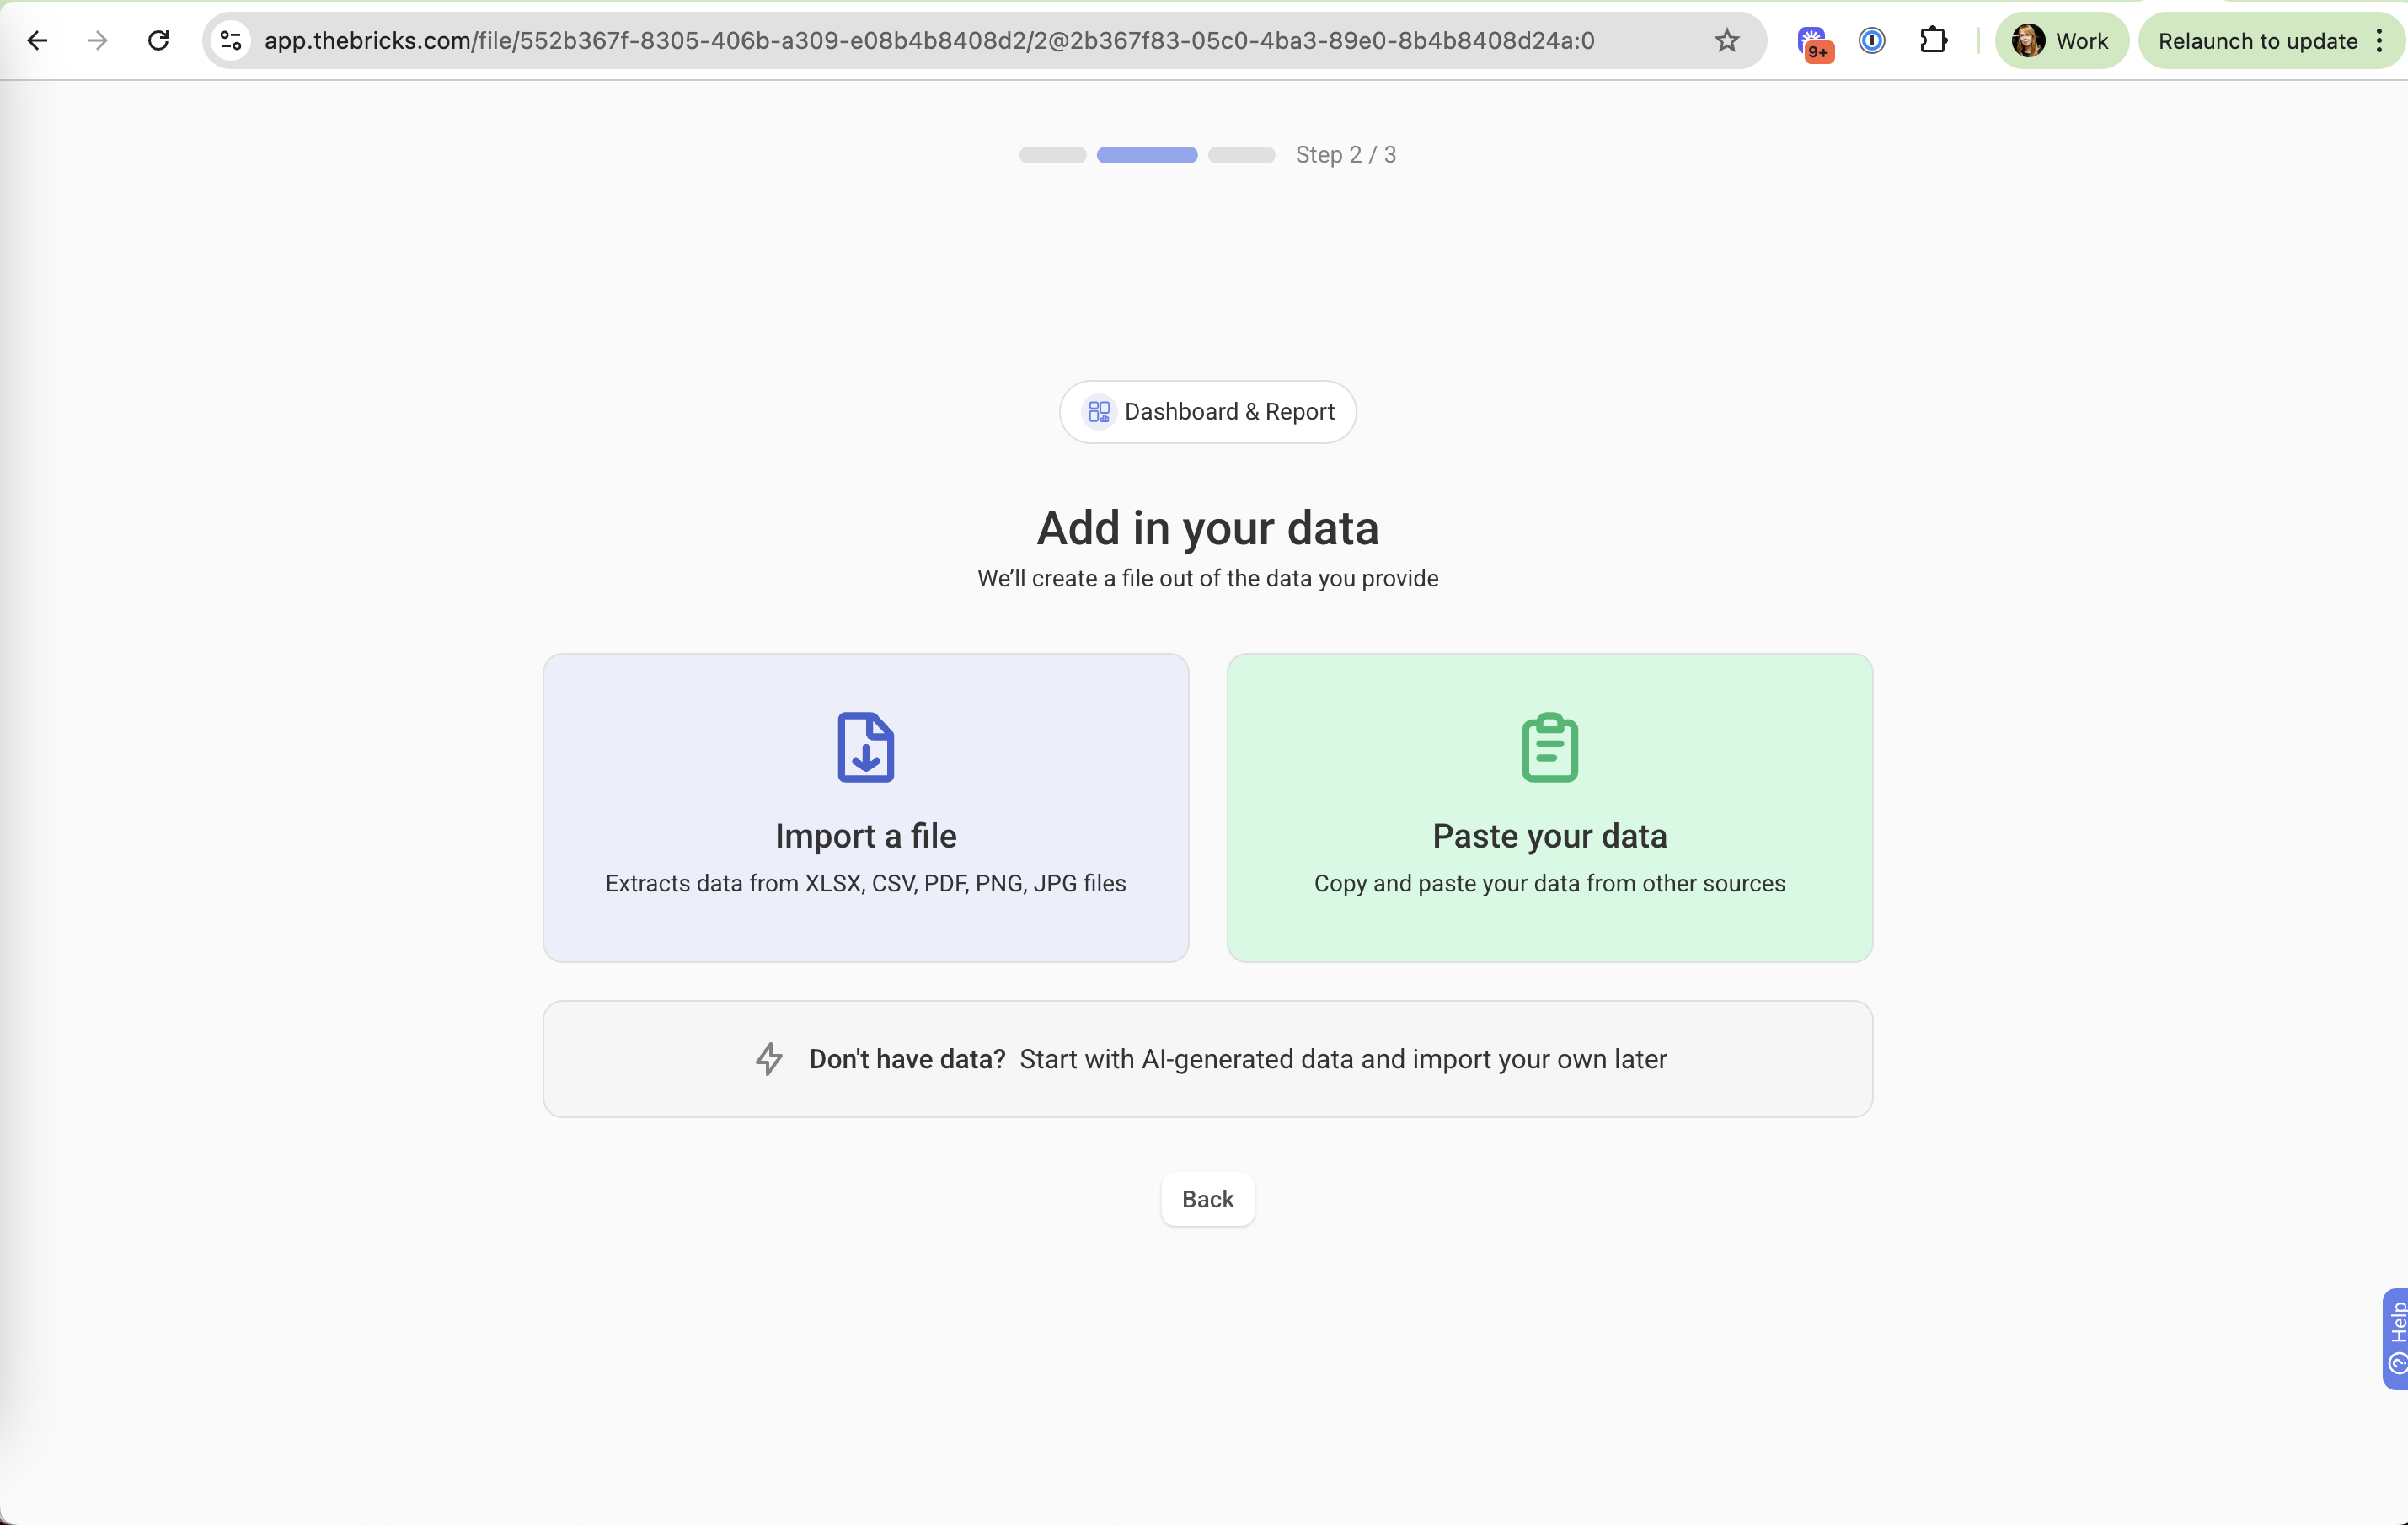
Upload, paste, or start with AI-generated sample data.
-
15
Choice carried forward (working)
The "Dashboard & Report" chip reminds you what you picked.
-
16
No Google Sheets link (not working)
The promo came from a Sheets guide, but only file import and paste are offered.
-
17
Paste as the easy path (working)
"Copy and paste your data from other sources" skips file handling.
-
18
No data, no problem (working)
"Start with AI-generated data and import your own later" keeps people without a file moving.
Generating the dashboard
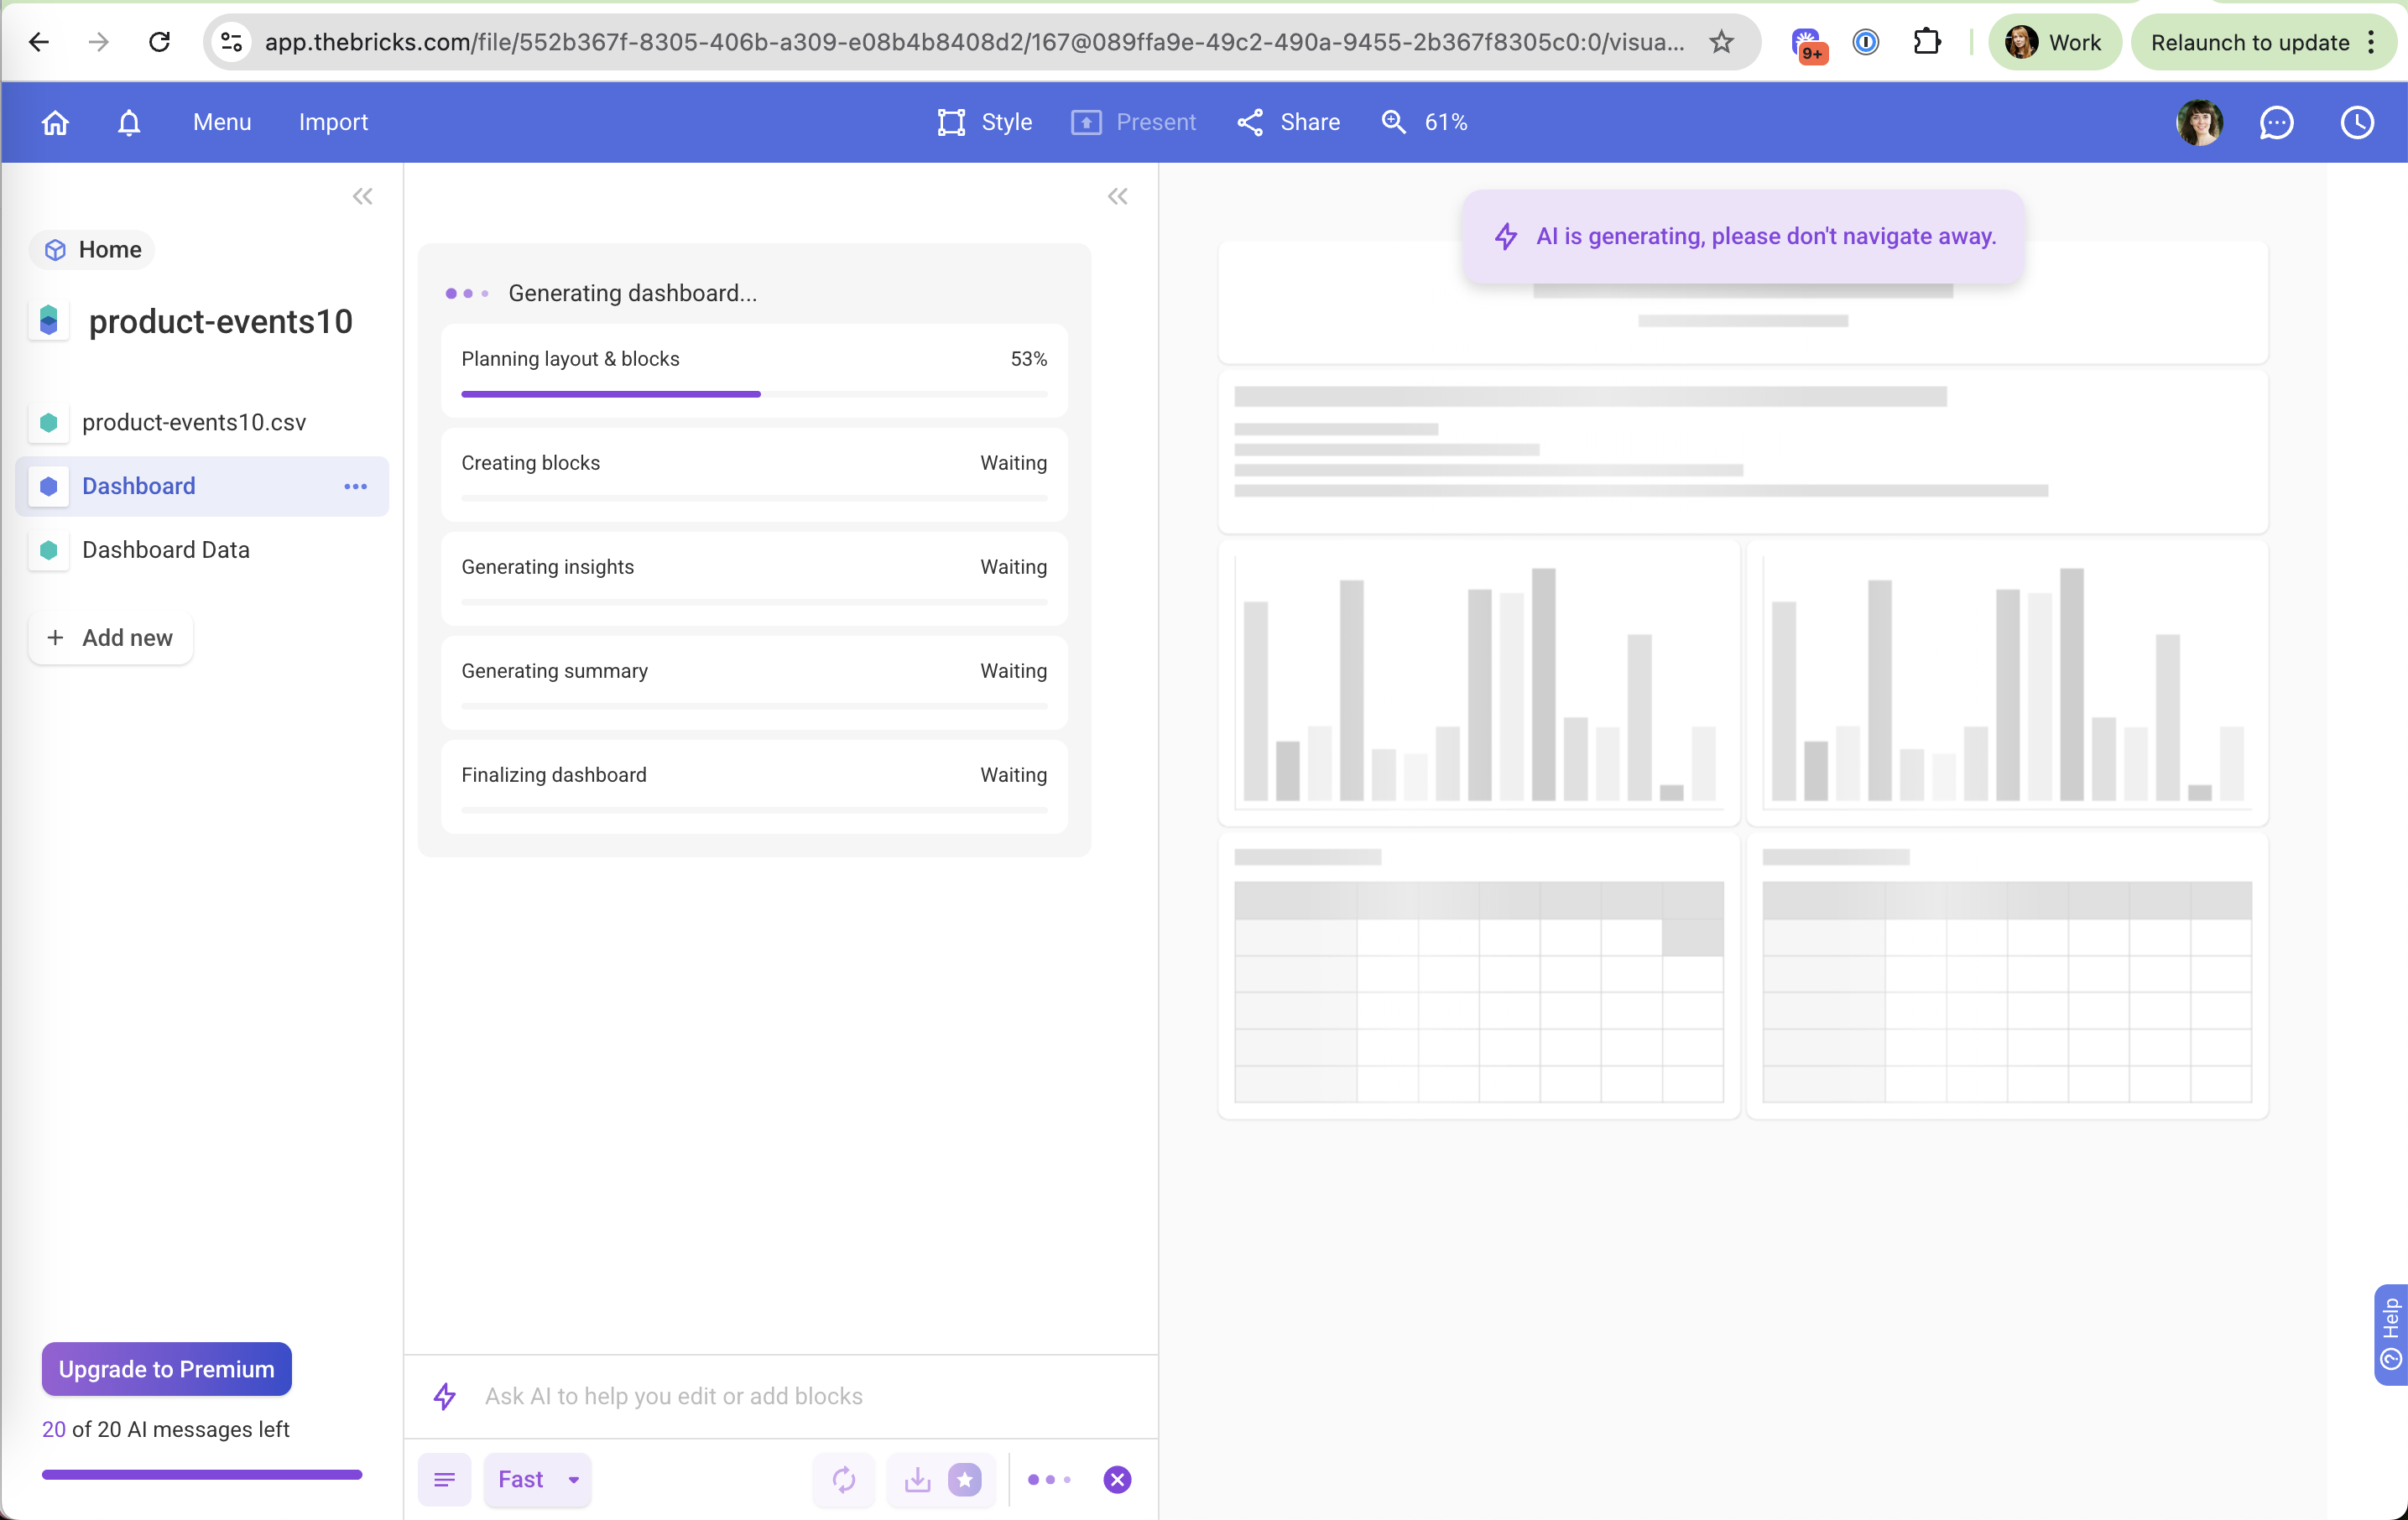
Generation shows named steps with progress and a skeleton of the layout.
-
19
Named progress steps (working)
"Planning layout & blocks 53%" then four waiting steps shows real work happening.
-
20
Don't leave (not working)
"AI is generating, please don't navigate away" holds the user on the page.
-
21
Skeleton of the result (working)
Grey charts and tables preview the layout before data arrives.
-
22
Quota next to Upgrade (working)
"20 of 20 AI messages left" with "Upgrade to Premium" right above.
Dashboard ready
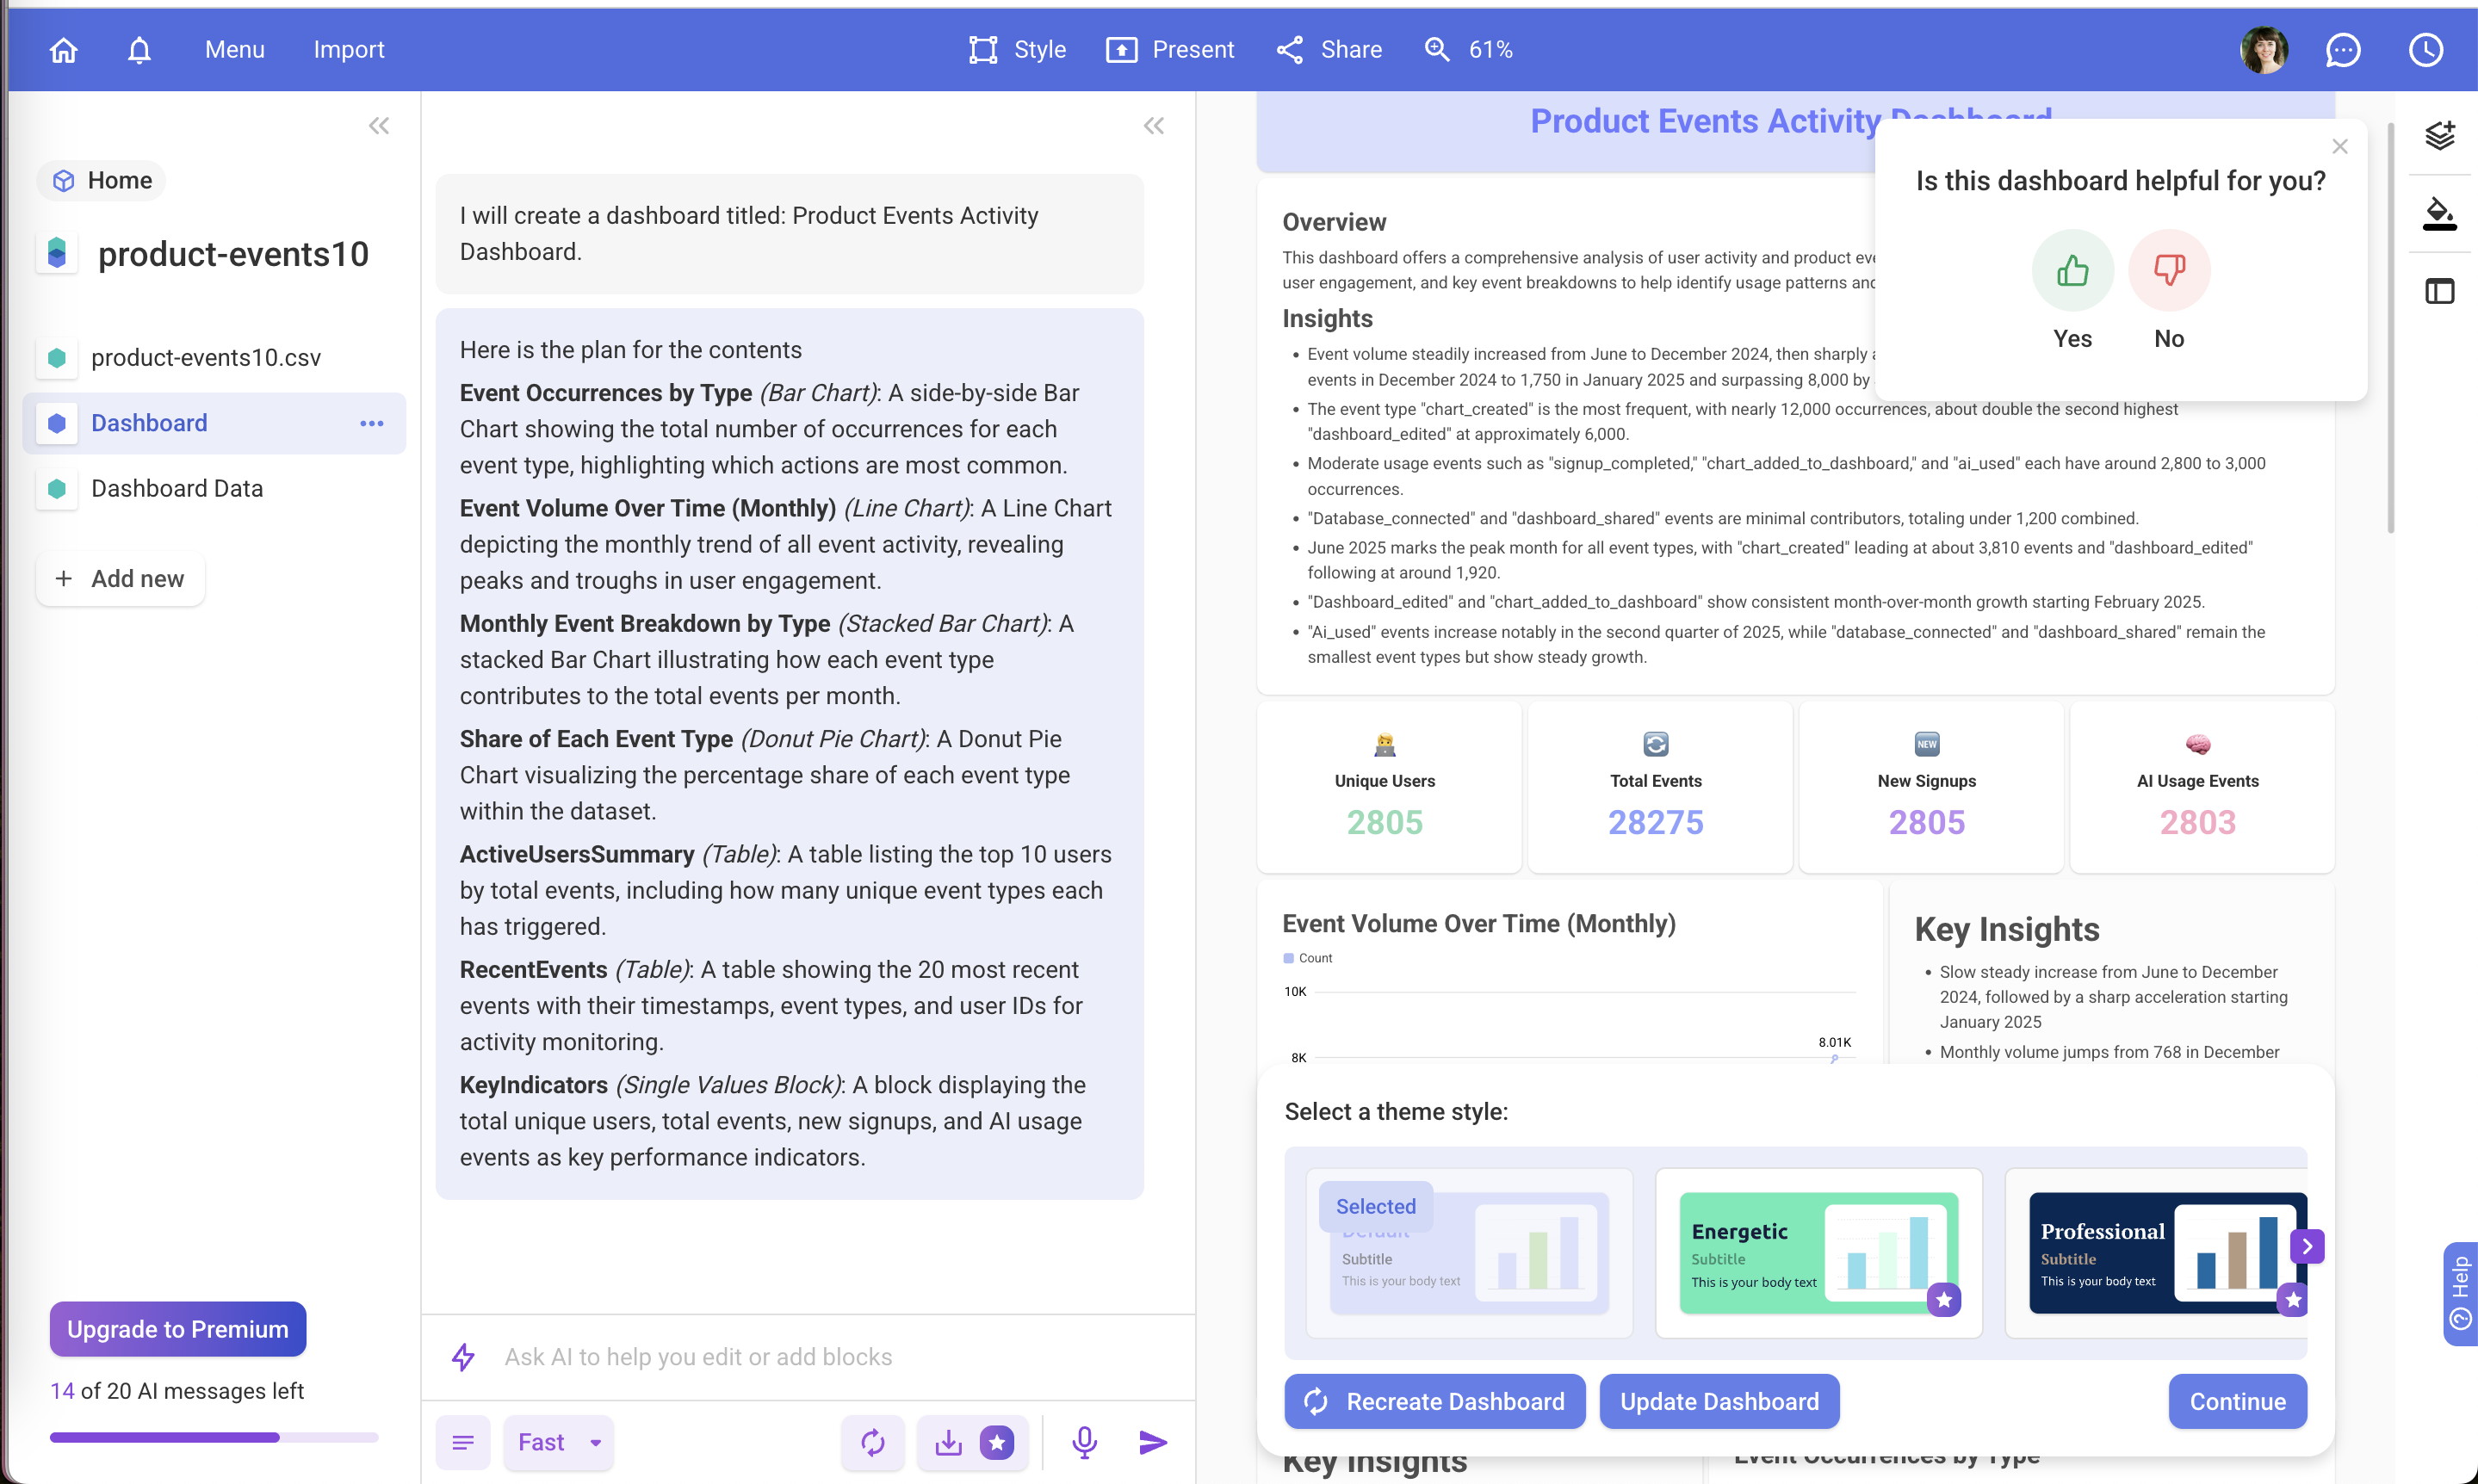
The dashboard appears with the AI's plan on the left, a theme picker and a feedback prompt.
-
23
Plan in plain language (working)
The chat lists every block and chart type it built and why.
-
24
Feedback before a look (not working)
"Is this dashboard helpful for you?" covers the title and insights on first render.
-
25
Numbers worth a second look (not working)
Unique Users and New Signups are both 2805, and AI Usage Events is 2803.
-
26
Premium themes marked (working)
Energetic and Professional carry a star, a soft upsell inside a choice you're already making.
-
27
Quota drops visibly (working)
"14 of 20 AI messages left" shows one dashboard cost 6 messages.
Takeaways from Bricks
- Match the in-product flow to the promise that brought the user in, here Google Sheets dashboards.
- Offer AI sample data so people without a file still reach the aha moment.
- Show generation as named steps and let the quota drop where users can see it.